US Airways 2011 Annual Report Download - page 66
Download and view the complete annual report
Please find page 66 of the 2011 US Airways annual report below. You can navigate through the pages in the report by either clicking on the pages listed below, or by using the keyword search tool below to find specific information within the annual report.-
 1
1 -
2
-
3
-
4
-
5
-
6
-
7
-
8
-
9
-
10
-
11
-
12
-
13
-
14
-
15
-
16
-
17
-
18
-
19
-
20
-
21
-
22
-
23
-
24
-
25
-
26
-
27
-
28
-
29
-
30
-
31
-
32
-
33
-
34
-
35
-
36
-
37
-
38
-
39
-
40
-
41
-
42
-
43
-
44
-
45
-
46
-
47
-
48
-
49
-
50
-
51
-
52
-
53
-
54
-
55
-
 56
56 -
 57
57 -
 58
58 -
 59
59 -
 60
60 -
 61
61 -
 62
62 -
 63
63 -
 64
64 -
 65
65 -
 66
66 -
 67
67 -
 68
68 -
 69
69 -
 70
70 -
 71
71 -
 72
72 -
 73
73 -
 74
74 -
 75
75 -
 76
76 -
77
-
78
-
79
-
80
-
81
-
82
-
83
-
84
-
85
-
86
-
87
-
88
-
89
-
90
-
91
-
92
-
93
-
94
-
95
-
96
-
97
-
98
-
99
-
100
-
101
-
102
-
103
-
104
-
105
-
106
-
107
-
108
-
109
-
110
-
111
-
112
-
113
-
114
-
115
-
116
-
117
-
118
-
119
-
120
-
121
-
122
-
123
-
124
-
125
-
126
-
127
-
128
-
129
-
130
-
131
-
132
-
133
-
134
-
135
-
136
-
137
-
138
-
139
-
140
-
141
-
142
-
143
-
144
-
145
-
146
-
147
-
148
-
149
-
150
-
151
-
152
-
153
-
154
-
155
-
156
-
157
-
158
-
159
-
160
-
161
-
162
-
163
-
164
-
165
-
166
-
167
-
168
-
169
-
170
-
171
 |
 |

Table of Contents
US Airways
2011 Compared to 2010
Operating Activities
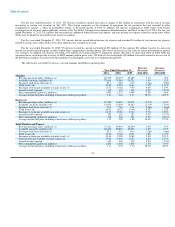
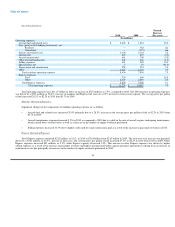
Net cash provided by operating activities was $440 million and $821 million in 2011 and 2010, respectively, a year-over-year decrease of $381 million.
The decline in operating cash flows was driven by lower net income in 2011 as mainline and Express fuel costs increased $1.29 billion, or 40.4%, on a 1.0%
increase in total system capacity. The increase in fuel costs was offset in part by growth in total operating revenues of $1.15 billion, or 9.6%, due principally
to the strong pricing environment resulting from ongoing industry capacity discipline and robust consumer demand. Higher amounts paid under capacity
purchase agreements due to increased maintenance costs related to the PSA CRJ-200 fleet also contributed to the decline in 2011 operating cash flows.
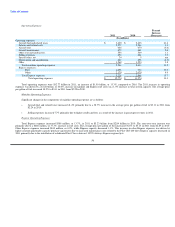
Investing Activities
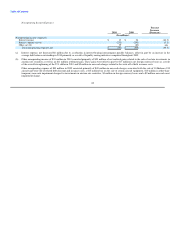
Net cash used in investing activities was $460 million in 2011 as compared to net cash provided by investing activities of $77 million in 2010. Principal
investing activities in 2011 included expenditures of $481 million for property and equipment, including the purchase of eight new Airbus aircraft, and
$100 million for aircraft pre-delivery deposits, as well as purchases of marketable securities of $30 million. These cash outflows were offset in part by cash
proceeds of $82 million from sales of marketable securities, which included $52 million related to the liquidation of US Airways' remaining investments in
auction rate securities, and net cash proceeds of $63 million obtained in the slot transaction with Delta.
Principal investing activities in 2010 included net proceeds from sales of marketable securities of $325 million, including sales of certain auction rate
securities of $145 million, and a $116 million decrease in restricted cash. These cash inflows were offset in part by expenditures for property and equipment
totaling $187 million and purchases of marketable securities of $180 million. Expenditures for property and equipment in 2010 related primarily to the
purchase of new Airbus aircraft and payments of aircraft pre-delivery deposits. Changes in restricted cash in 2010 reflect adjustments to the amount of
holdback held by certain credit card processors for advance ticket sales for which US Airways has not yet provided air transportation.
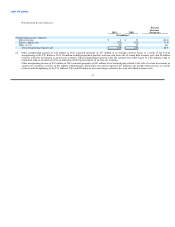
Financing Activities
Net cash provided by financing activities was $104 million in 2011 as compared to net cash used in financing activities of $251 million in 2010.
Principal financing activities in 2011 included proceeds from the issuance of debt of $764 million, which included $471 million of proceeds from the issuance
of the Series 2011-1 Class A, Class B and Class C Enhanced Equipment Trust Certificates in connection with the refinancing of five Airbus aircraft owned by
US Airways and the financing of four new Airbus aircraft delivered in 2011 (the "2011 EETCs") as well as the issuance of Class C certificates in the
aggregate principal amount of $53 million under the Series 2010-1 EETCs. The 2010-1 Class A and B certificates originally closed in December 2010 in
connection with the refinancing of owned Airbus aircraft (the "2010 EETCs"). Debt repayments were $659 million, which included the repayment of existing
debt associated with five Airbus aircraft refinanced using cash provided in the 2011 EETC issuance described above.
Principal financing activities in 2010 included debt repayments of $679 million, which included the repayment of existing debt associated with eight
Airbus aircraft refinanced using cash provided in the 2010 EETC issuance. Proceeds from the issuance of debt were $437 million, which included
$340 million of proceeds from the issuance of equipment notes associated with the 2010 EETCs as well as the financing associated with the purchase of new
Airbus aircraft.
63