US Airways 2011 Annual Report Download - page 58
Download and view the complete annual report
Please find page 58 of the 2011 US Airways annual report below. You can navigate through the pages in the report by either clicking on the pages listed below, or by using the keyword search tool below to find specific information within the annual report.-
 1
1 -
2
-
3
-
4
-
5
-
6
-
7
-
8
-
9
-
10
-
11
-
12
-
13
-
14
-
15
-
16
-
17
-
18
-
19
-
20
-
21
-
22
-
23
-
24
-
25
-
26
-
27
-
28
-
29
-
30
-
31
-
32
-
33
-
34
-
35
-
36
-
37
-
38
-
39
-
40
-
41
-
42
-
43
-
44
-
45
-
46
-
47
-
 48
48 -
 49
49 -
 50
50 -
 51
51 -
 52
52 -
 53
53 -
 54
54 -
 55
55 -
 56
56 -
 57
57 -
 58
58 -
 59
59 -
 60
60 -
 61
61 -
 62
62 -
 63
63 -
 64
64 -
 65
65 -
 66
66 -
 67
67 -
 68
68 -
69
-
70
-
71
-
72
-
73
-
74
-
75
-
76
-
77
-
78
-
79
-
80
-
81
-
82
-
83
-
84
-
85
-
86
-
87
-
88
-
89
-
90
-
91
-
92
-
93
-
94
-
95
-
96
-
97
-
98
-
99
-
100
-
101
-
102
-
103
-
104
-
105
-
106
-
107
-
108
-
109
-
110
-
111
-
112
-
113
-
114
-
115
-
116
-
117
-
118
-
119
-
120
-
121
-
122
-
123
-
124
-
125
-
126
-
127
-
128
-
129
-
130
-
131
-
132
-
133
-
134
-
135
-
136
-
137
-
138
-
139
-
140
-
141
-
142
-
143
-
144
-
145
-
146
-
147
-
148
-
149
-
150
-
151
-
152
-
153
-
154
-
155
-
156
-
157
-
158
-
159
-
160
-
161
-
162
-
163
-
164
-
165
-
166
-
167
-
168
-
169
-
170
-
171
 |
 |

Table of Contents
(a) Revenue passenger mile ("RPM") — A basic measure of sales volume. One RPM represents one passenger flown one mile.
(b) Available seat mile ("ASM") — A basic measure of production. One ASM represents one seat flown one mile.
(c) Passenger load factor — The percentage of available seats that are filled with revenue passengers.
(d) Yield — A measure of airline revenue derived by dividing passenger revenue by RPMs.
(e) Passenger revenue per available seat mile ("PRASM") — Passenger revenues divided by ASMs.
(f) Express statistics include Piedmont and PSA, as well as operating and financial results from capacity purchase agreements with Air Wisconsin Airlines
Corporation, Republic Airline Inc., Mesa Airlines, Inc., Chautauqua Airlines, Inc. and SkyWest Airlines, Inc.
(g) Total revenue per available seat mile ("RASM") — Total revenues divided by total mainline and Express ASMs.
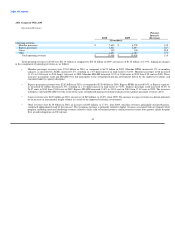
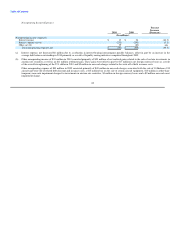
2011 Compared With 2010
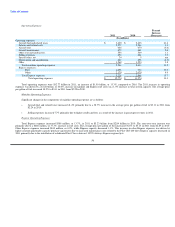
Operating Revenues:
Percent
Increase
2011 2010 (Decrease)
(In millions)
Operating revenues:
Mainline passenger $ 8,501 $ 7,645 11.2
Express passenger 3,061 2,821 8.5
Cargo 170 149 13.8
Other 1,476 1,440 2.6
Total operating revenues $ 13,208 $ 12,055 9.6
Total operating revenues in 2011 were $13.21 billion as compared to $12.06 billion in 2010, an increase of $1.15 billion, or 9.6%. Significant changes
in the components of operating revenues are as follows:
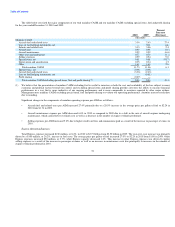
• Mainline passenger revenues were $8.50 billion in 2011 as compared to $7.65 billion in 2010. Mainline RPMs increased 3.1% as mainline
capacity, as measured by ASMs, increased 1.4%, resulting in a 1.3 point increase in load factor to 83.7%. Mainline passenger yield increased
7.9% to 13.99 cents in 2011 from 12.96 cents in 2010. Mainline PRASM increased 9.6% to 11.71 cents in 2011 from 10.68 cents in 2010. These
increases in mainline yield and PRASM were due principally to the strong pricing environment resulting from ongoing industry capacity
discipline and robust consumer demand.
• Express passenger revenues were $3.06 billion in 2011 as compared to $2.82 billion in 2010. Express RPMs decreased 0.7% as Express capacity,
as measured by ASMs, decreased 1.1%, resulting in a 0.3 point increase in load factor to 74.9%. Express passenger yield increased by 9.3% to
29.03 cents in 2011 from 26.57 cents in 2010. Express PRASM increased 9.7% to 21.75 cents in 2011 from 19.83 cents in 2010. The increases in
Express yield and PRASM were the result of the same strong pricing environment discussed in mainline passenger revenues above.
• Cargo revenues were $170 million in 2011, an increase of $21 million, or 13.8%, from 2010. The increase in cargo revenues was driven primarily
by an increase in yield due to fuel surcharges.
• Other revenues were $1.48 billion in 2011, an increase of $36 million, or 2.6%, from 2010. The increase in other revenues was driven primarily
by increases in the volume of passenger ticketing change fees.
55