US Airways 2011 Annual Report Download - page 78
Download and view the complete annual report
Please find page 78 of the 2011 US Airways annual report below. You can navigate through the pages in the report by either clicking on the pages listed below, or by using the keyword search tool below to find specific information within the annual report.-
 1
1 -
2
-
3
-
4
-
5
-
6
-
7
-
8
-
9
-
10
-
11
-
12
-
13
-
14
-
15
-
16
-
17
-
18
-
19
-
20
-
21
-
22
-
23
-
24
-
25
-
26
-
27
-
28
-
29
-
30
-
31
-
32
-
33
-
34
-
35
-
36
-
37
-
38
-
39
-
40
-
41
-
42
-
43
-
44
-
45
-
46
-
47
-
48
-
49
-
50
-
51
-
52
-
53
-
54
-
55
-
56
-
57
-
58
-
59
-
60
-
61
-
62
-
63
-
64
-
65
-
66
-
67
-
 68
68 -
 69
69 -
 70
70 -
 71
71 -
 72
72 -
 73
73 -
 74
74 -
 75
75 -
 76
76 -
 77
77 -
 78
78 -
 79
79 -
 80
80 -
 81
81 -
 82
82 -
 83
83 -
 84
84 -
 85
85 -
 86
86 -
 87
87 -
 88
88 -
89
-
90
-
91
-
92
-
93
-
94
-
95
-
96
-
97
-
98
-
99
-
100
-
101
-
102
-
103
-
104
-
105
-
106
-
107
-
108
-
109
-
110
-
111
-
112
-
113
-
114
-
115
-
116
-
117
-
118
-
119
-
120
-
121
-
122
-
123
-
124
-
125
-
126
-
127
-
128
-
129
-
130
-
131
-
132
-
133
-
134
-
135
-
136
-
137
-
138
-
139
-
140
-
141
-
142
-
143
-
144
-
145
-
146
-
147
-
148
-
149
-
150
-
151
-
152
-
153
-
154
-
155
-
156
-
157
-
158
-
159
-
160
-
161
-
162
-
163
-
164
-
165
-
166
-
167
-
168
-
169
-
170
-
171
 |
 |

Table of Contents
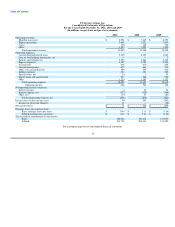
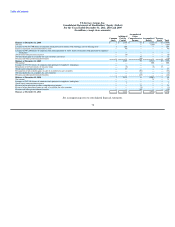
US Airways Group, Inc.
Consolidated Statements of Operations
For the Years Ended December 31, 2011, 2010 and 2009
(In millions, except share and per share amounts)
2011 2010 2009
Operating revenues:
Mainline passenger $ 8,501 $ 7,645 $ 6,752
Express passenger 3,061 2,821 2,503
Cargo 170 149 100
Other 1,323 1,293 1,103
Total operating revenues 13,055 11,908 10,458
Operating expenses:
Aircraft fuel and related taxes 3,400 2,403 1,863
Loss on fuel hedging instruments, net — — 7
Salaries and related costs 2,272 2,244 2,165
Express expenses 3,127 2,729 2,519
Aircraft rent 646 670 695
Aircraft maintenance 679 661 700
Other rent and landing fees 555 549 560
Selling expenses 454 421 382
Special items, net 24 5 55
Depreciation and amortization 237 248 242
Other 1,235 1,197 1,152
Total operating expenses 12,629 11,127 10,340
Operating income 426 781 118
Nonoperating income (expense):
Interest income 4 13 24
Interest expense, net (327) (329) (304)
Other, net (13) 37 (81)
Total nonoperating expense, net (336) (279) (361)
Income (loss) before income taxes 90 502 (243)
Income tax provision (benefit) 19 — (38)
Net income (loss) $ 71 $ 502 $ (205)
Earnings (loss) per common share:
Basic earnings (loss) per share $ 0.44 $ 3.11 $ (1.54)
Diluted earnings (loss) per share $ 0.44 $ 2.61 $ (1.54)
Shares used for computation (in thousands):
Basic 162,028 161,412 133,000
Diluted 163,743 201,131 133,000
See accompanying notes to consolidated financial statements.
75