US Airways 2011 Annual Report Download - page 111
Download and view the complete annual report
Please find page 111 of the 2011 US Airways annual report below. You can navigate through the pages in the report by either clicking on the pages listed below, or by using the keyword search tool below to find specific information within the annual report.-
 1
1 -
2
-
3
-
4
-
5
-
6
-
7
-
8
-
9
-
10
-
11
-
12
-
13
-
14
-
15
-
16
-
17
-
18
-
19
-
20
-
21
-
22
-
23
-
24
-
25
-
26
-
27
-
28
-
29
-
30
-
31
-
32
-
33
-
34
-
35
-
36
-
37
-
38
-
39
-
40
-
41
-
42
-
43
-
44
-
45
-
46
-
47
-
48
-
49
-
50
-
51
-
52
-
53
-
54
-
55
-
56
-
57
-
58
-
59
-
60
-
61
-
62
-
63
-
64
-
65
-
66
-
67
-
68
-
69
-
70
-
71
-
72
-
73
-
74
-
75
-
76
-
77
-
78
-
79
-
80
-
81
-
82
-
83
-
84
-
85
-
86
-
87
-
88
-
89
-
90
-
91
-
92
-
93
-
94
-
95
-
96
-
97
-
98
-
99
-
100
-
 101
101 -
 102
102 -
 103
103 -
 104
104 -
 105
105 -
 106
106 -
 107
107 -
 108
108 -
 109
109 -
 110
110 -
 111
111 -
 112
112 -
 113
113 -
 114
114 -
 115
115 -
 116
116 -
 117
117 -
 118
118 -
 119
119 -
 120
120 -
 121
121 -
122
-
123
-
124
-
125
-
126
-
127
-
128
-
129
-
130
-
131
-
132
-
133
-
134
-
135
-
136
-
137
-
138
-
139
-
140
-
141
-
142
-
143
-
144
-
145
-
146
-
147
-
148
-
149
-
150
-
151
-
152
-
153
-
154
-
155
-
156
-
157
-
158
-
159
-
160
-
161
-
162
-
163
-
164
-
165
-
166
-
167
-
168
-
169
-
170
-
171
 |
 |
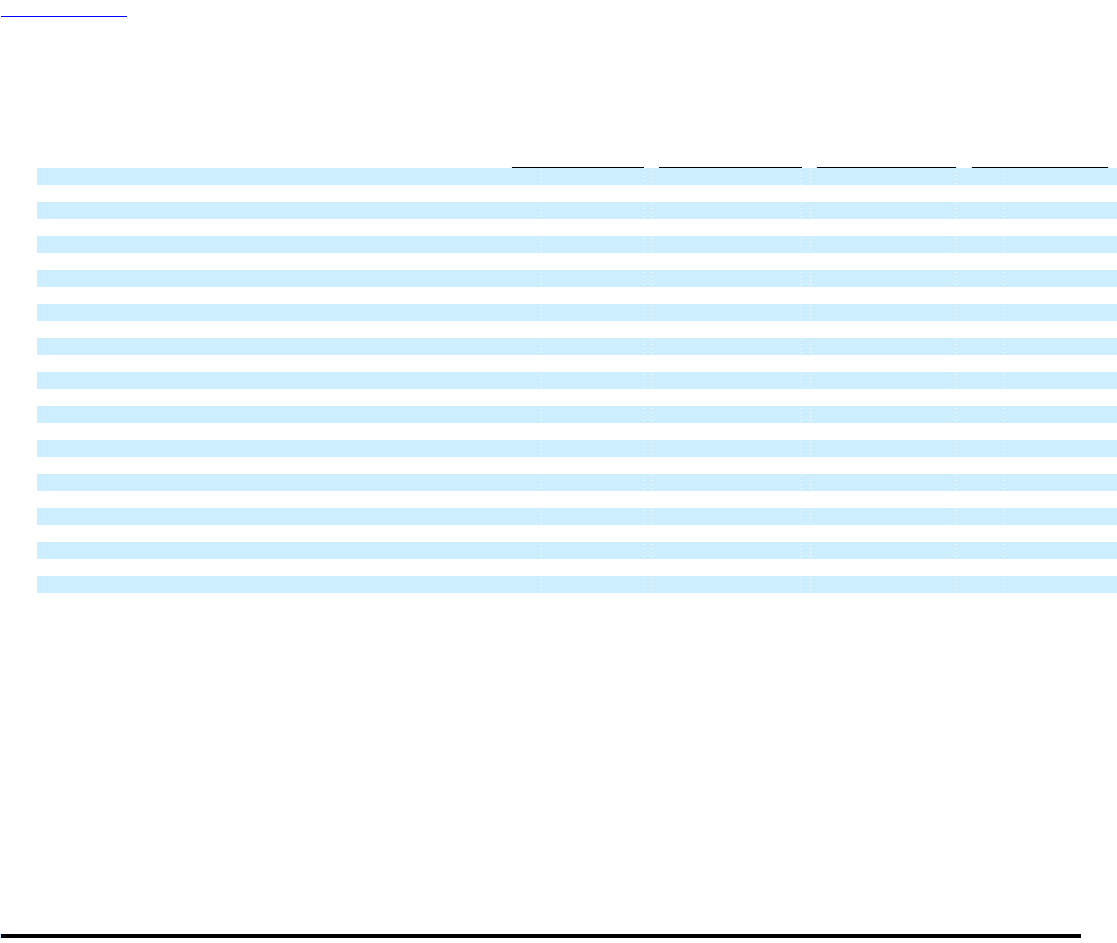
Table of Contents
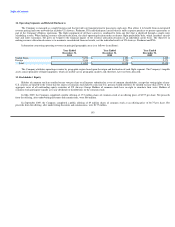
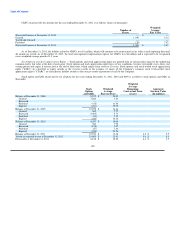
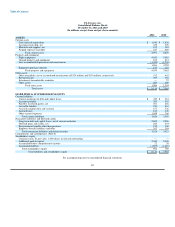
17. Selected Quarterly Financial Information (unaudited)
Summarized quarterly financial information for 2011 and 2010 is as follows (in millions, except share and per share amounts):
1st Quarter 2nd Quarter 3rd Quarter 4th Quarter
2011
Operating revenues $ 2,961 $ 3,503 $ 3,436 $ 3,155
Operating expenses 3,000 3,326 3,256 3,047
Operating income (loss) (39) 177 180 108
Nonoperating expenses, net (75) (85) (83) (92)
Income tax provision (benefit) — — 21 (2)
Net income (loss) (114) 92 76 18
Earnings (loss) per common share:
Basic: $ (0.71) $ 0.57 $ 0.47 $ 0.11
Diluted: $ (0.71) $ 0.49 $ 0.41 $ 0.11
Shares used for computation (in thousands):
Basic 161,890 162,016 162,090 162,115
Diluted 161,890 202,106 201,278 163,222
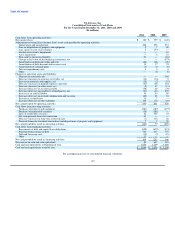
2010
Operating revenues $ 2,651 $ 3,171 $ 3,179 $ 2,907
Operating expenses 2,661 2,800 2,864 2,802
Operating income (loss) (10) 371 315 105
Nonoperating expenses, net (35) (92) (74) (78)
Income tax provision (benefit) — — 1 (1)
Net income (loss) (45) 279 240 28
Earnings (loss) per common share:
Basic: $ (0.28) $ 1.73 $ 1.49 $ 0.17
Diluted: $ (0.28) $ 1.41 $ 1.22 $ 0.17
Shares used for computation (in thousands):
Basic 161,115 161,292 161,464 161,776
Diluted 161,115 203,809 204,535 202,200
The Company's 2011 and 2010 fourth quarter results were impacted by recognition of the following net special items:
Fourth quarter 2011 operating expenses included $2 million in legal costs incurred in connection with auction rate securities arbitration and $1 million
in Express other special charges.
Fourth quarter 2010 operating expenses included a $6 million non-cash charge related to the decline in value of certain spare parts. Nonoperating
expenses, net included an $11 million settlement gain, offset in part by $5 million in non-cash charges related to the write off of debt issuance costs.
18. Subsequent Event
In February 2012, the Company amended its co-branded credit card agreement with Barclays Bank Delaware. This amendment provides that the $200
million pre-purchase of frequent flier miles previously scheduled to reduce commencing in January 2012 will now be reduced commencing in January 2014
over a period of up to approximately two years. Refer to Note 4(d) for additional information on this agreement.
108