US Airways 2011 Annual Report Download - page 59
Download and view the complete annual report
Please find page 59 of the 2011 US Airways annual report below. You can navigate through the pages in the report by either clicking on the pages listed below, or by using the keyword search tool below to find specific information within the annual report.-
 1
1 -
2
-
3
-
4
-
5
-
6
-
7
-
8
-
9
-
10
-
11
-
12
-
13
-
14
-
15
-
16
-
17
-
18
-
19
-
20
-
21
-
22
-
23
-
24
-
25
-
26
-
27
-
28
-
29
-
30
-
31
-
32
-
33
-
34
-
35
-
36
-
37
-
38
-
39
-
40
-
41
-
42
-
43
-
44
-
45
-
46
-
47
-
48
-
 49
49 -
 50
50 -
 51
51 -
 52
52 -
 53
53 -
 54
54 -
 55
55 -
 56
56 -
 57
57 -
 58
58 -
 59
59 -
 60
60 -
 61
61 -
 62
62 -
 63
63 -
 64
64 -
 65
65 -
 66
66 -
 67
67 -
 68
68 -
 69
69 -
70
-
71
-
72
-
73
-
74
-
75
-
76
-
77
-
78
-
79
-
80
-
81
-
82
-
83
-
84
-
85
-
86
-
87
-
88
-
89
-
90
-
91
-
92
-
93
-
94
-
95
-
96
-
97
-
98
-
99
-
100
-
101
-
102
-
103
-
104
-
105
-
106
-
107
-
108
-
109
-
110
-
111
-
112
-
113
-
114
-
115
-
116
-
117
-
118
-
119
-
120
-
121
-
122
-
123
-
124
-
125
-
126
-
127
-
128
-
129
-
130
-
131
-
132
-
133
-
134
-
135
-
136
-
137
-
138
-
139
-
140
-
141
-
142
-
143
-
144
-
145
-
146
-
147
-
148
-
149
-
150
-
151
-
152
-
153
-
154
-
155
-
156
-
157
-
158
-
159
-
160
-
161
-
162
-
163
-
164
-
165
-
166
-
167
-
168
-
169
-
170
-
171
 |
 |

Table of Contents
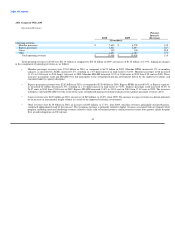
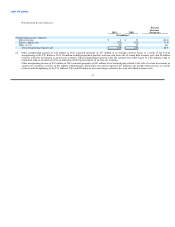
Operating Expenses:
Percent
Increase
2011 2010 (Decrease)
(In millions)
Operating expenses:
Aircraft fuel and related taxes $ 3,400 $ 2,403 41.4
Salaries and related costs 2,272 2,244 1.3
Aircraft rent 646 670 (3.6)
Aircraft maintenance 679 661 2.6
Other rent and landing fees 555 549 1.1
Selling expenses 454 421 7.7
Special items, net 24 5 nm
Depreciation and amortization 247 258 (4.3)
Other 1,269 1,223 3.8
Total mainline operating expenses 9,546 8,434 13.2
Express expenses:
Fuel 1,058 770 37.3
Other 2,170 2,070 4.9
Total Express expenses 3,228 2,840 13.7
Total operating expenses $ 12,774 $ 11,274 13.3
Total operating expenses were $12.77 billion in 2011, an increase of $1.50 billion, or 13.3%, compared to 2010. The 2011 increase in operating
expenses was driven by a $1.28 billion, or 40.4%, increase in mainline and Express fuel costs on a 1.0% increase in total system capacity. The average price
per gallon of fuel increased 38.2% to $3.11 in 2011 from $2.25 in 2010.
Mainline Operating Expenses:
Significant changes in the components of mainline operating expense are as follows:
• Aircraft fuel and related taxes increased 41.4% primarily due to a 38.7% increase in the average price per gallon of fuel to $3.11 in 2011 from
$2.24 in 2010.
• Selling expenses increased 7.7% primarily due to higher credit card fees as a result of the increase in passenger revenues in 2011.
Express Operating Expenses:
Total Express expenses increased $388 million, or 13.7%, in 2011 to $3.23 billion from $2.84 billion in 2010. The year-over-year increase was
primarily due to a $288 million, or 37.3%, increase in fuel costs. The average price per gallon of fuel increased 36.6% to $3.13 in 2011 from $2.29 in 2010.
Other Express expenses increased $100 million, or 4.9%, while Express capacity decreased 1.1%. This increase in other Express expenses was driven by
higher amounts paid under capacity purchase agreements due to increased maintenance costs related to the PSA CRJ-200 fleet. Express capacity decreased in
2011 primarily due to the installation of a dedicated First Class cabin on 110 US Airways Express regional jets.
56