US Airways 2011 Annual Report Download - page 109
Download and view the complete annual report
Please find page 109 of the 2011 US Airways annual report below. You can navigate through the pages in the report by either clicking on the pages listed below, or by using the keyword search tool below to find specific information within the annual report.-
 1
1 -
2
-
3
-
4
-
5
-
6
-
7
-
8
-
9
-
10
-
11
-
12
-
13
-
14
-
15
-
16
-
17
-
18
-
19
-
20
-
21
-
22
-
23
-
24
-
25
-
26
-
27
-
28
-
29
-
30
-
31
-
32
-
33
-
34
-
35
-
36
-
37
-
38
-
39
-
40
-
41
-
42
-
43
-
44
-
45
-
46
-
47
-
48
-
49
-
50
-
51
-
52
-
53
-
54
-
55
-
56
-
57
-
58
-
59
-
60
-
61
-
62
-
63
-
64
-
65
-
66
-
67
-
68
-
69
-
70
-
71
-
72
-
73
-
74
-
75
-
76
-
77
-
78
-
79
-
80
-
81
-
82
-
83
-
84
-
85
-
86
-
87
-
88
-
89
-
90
-
91
-
92
-
93
-
94
-
95
-
96
-
97
-
98
-
 99
99 -
 100
100 -
 101
101 -
 102
102 -
 103
103 -
 104
104 -
 105
105 -
 106
106 -
 107
107 -
 108
108 -
 109
109 -
 110
110 -
 111
111 -
 112
112 -
 113
113 -
 114
114 -
 115
115 -
 116
116 -
 117
117 -
 118
118 -
 119
119 -
120
-
121
-
122
-
123
-
124
-
125
-
126
-
127
-
128
-
129
-
130
-
131
-
132
-
133
-
134
-
135
-
136
-
137
-
138
-
139
-
140
-
141
-
142
-
143
-
144
-
145
-
146
-
147
-
148
-
149
-
150
-
151
-
152
-
153
-
154
-
155
-
156
-
157
-
158
-
159
-
160
-
161
-
162
-
163
-
164
-
165
-
166
-
167
-
168
-
169
-
170
-
171
 |
 |

Table of Contents
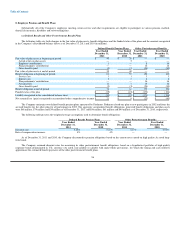
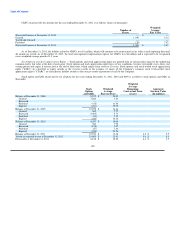
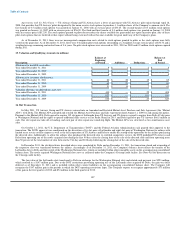
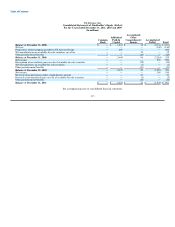
CSAR award activity for all plans for the years ending December 31, 2011, 2010 and 2009 is as follows (CSARs in thousands):
Weighted
Average
Weighted Remaining Aggregate
Average Contractual Term Intrinsic Value
CSARs Exercise Price (years) (In millions)
Balance at December 31, 2008 — $ —
Granted 4,645 3.10
Exercised — —
Forfeited (232) 3.10
Expired — —
Balance at December 31, 2009 4,413 $ 3.10
Granted 1,865 7.42
Exercised (1,028) 3.10
Forfeited (196) 4.15
Expired — —
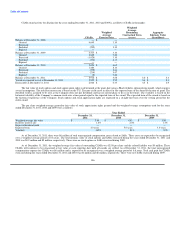
Balance at December 31, 2010 5,054 $ 4.65
Granted 1,484 8.14
Exercised (395) 3.44
Forfeited (219) 5.47
Expired (8) 7.42
Balance at December 31, 2011 5,916 $ 5.58 5.0 $ 5.4
Vested or expected to vest at December 31, 2011 5,852 $ 5.55 5.0 $ 5.4
Exercisable at December 31, 2011 2,064 $ 4.33 4.5 $ 2.9
The fair value of stock options and stock appreciation rights is determined at the grant date using a Black-Scholes option pricing model, which requires
several assumptions. The risk-free interest rate is based on the U.S. Treasury yield curve in effect for the expected term of the award at the time of grant. The
dividend yield is assumed to be zero as the Company does not pay dividends and has no current plans to do so in the future. The volatility is based on the
historical volatility of the Company's common stock over a time period equal to the expected term of the award. The expected term of the award is based on
the historical experience of the Company. Stock options and stock appreciation rights are expensed on a straight-line basis over the vesting period for the
entire award.
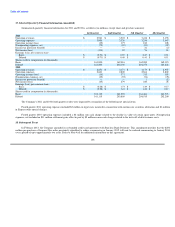
The per share weighted-average grant-date fair value of stock appreciation rights granted and the weighted-average assumptions used for the years
ended December 31, 2011, 2010 and 2009 were as follows:
Year Ended
December 31, December 31, December 31,
2011 2010 2009
Weighted average fair value $ 5.65 $ 4.93 $ 1.84
Risk free interest rate 1.6% 2.4% 1.3%
Expected dividend yield — — —
Expected term 4.0 years 5.0 years 3.0 years
Volatility 102% 81% 92%
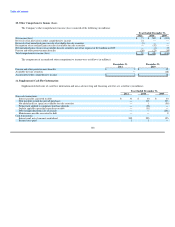
As of December 31, 2011, there were $6 million of total unrecognized compensation costs related to SARs. These costs are expected to be recognized
over a weighted average period of 0.8 years. The total intrinsic value of stock options and SARs exercised during the years ended December 31, 2011 and
2010 was $0.2 million and $5 million, respectively. There were no stock options or SARs exercised during 2009.
As of December 31, 2011, the weighted average fair value of outstanding CSARs was $2.58 per share and the related liability was $9 million. These
CSARs will continue to be remeasured at fair value at each reporting date until all awards are settled. As of December 31, 2011, the total unrecognized
compensation expense for CSARs was $6 million and is expected to be recognized over a weighted average period of 0.8 years. Total cash paid for CSARs
exercised during the years ended December 31, 2011 and 2010 was $2 million and $6 million, respectively. There were no CSARs exercised during 2009.
106