US Airways 2011 Annual Report Download - page 42
Download and view the complete annual report
Please find page 42 of the 2011 US Airways annual report below. You can navigate through the pages in the report by either clicking on the pages listed below, or by using the keyword search tool below to find specific information within the annual report.-
 1
1 -
2
-
3
-
4
-
5
-
6
-
7
-
8
-
9
-
10
-
11
-
12
-
13
-
14
-
15
-
16
-
17
-
18
-
19
-
20
-
21
-
22
-
23
-
24
-
25
-
26
-
27
-
28
-
29
-
30
-
31
-
 32
32 -
 33
33 -
 34
34 -
 35
35 -
 36
36 -
 37
37 -
 38
38 -
 39
39 -
 40
40 -
 41
41 -
 42
42 -
 43
43 -
 44
44 -
 45
45 -
 46
46 -
 47
47 -
 48
48 -
 49
49 -
 50
50 -
 51
51 -
 52
52 -
53
-
54
-
55
-
56
-
57
-
58
-
59
-
60
-
61
-
62
-
63
-
64
-
65
-
66
-
67
-
68
-
69
-
70
-
71
-
72
-
73
-
74
-
75
-
76
-
77
-
78
-
79
-
80
-
81
-
82
-
83
-
84
-
85
-
86
-
87
-
88
-
89
-
90
-
91
-
92
-
93
-
94
-
95
-
96
-
97
-
98
-
99
-
100
-
101
-
102
-
103
-
104
-
105
-
106
-
107
-
108
-
109
-
110
-
111
-
112
-
113
-
114
-
115
-
116
-
117
-
118
-
119
-
120
-
121
-
122
-
123
-
124
-
125
-
126
-
127
-
128
-
129
-
130
-
131
-
132
-
133
-
134
-
135
-
136
-
137
-
138
-
139
-
140
-
141
-
142
-
143
-
144
-
145
-
146
-
147
-
148
-
149
-
150
-
151
-
152
-
153
-
154
-
155
-
156
-
157
-
158
-
159
-
160
-
161
-
162
-
163
-
164
-
165
-
166
-
167
-
168
-
169
-
170
-
171
 |
 |

Table of Contents
US Airways Group
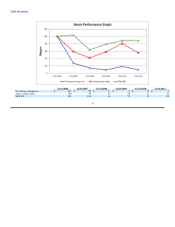
The year ended December 31, 2011 marked our second consecutive year of profitability in an environment of uncertain economic conditions and high
fuel costs. For the year ended December 31, 2011, we realized operating income of $426 million and net income of $71 million. Our 2011 profitability was
driven by higher revenues resulting from a strong pricing environment, which substantially offset the increase in our fuel costs. This compares to operating
income of $781 million and net income of $502 million in 2010. The year-over-year decline in profitability was principally due to higher fuel costs as well as
higher maintenance costs for our Express fleet in 2011.
Additionally for the fourth quarter, a period in which passenger demand has been historically low, we reported our second consecutive fourth quarter of
profitability. For the fourth quarter of 2011, we realized operating income of $108 million and net income of $18 million. This compares to operating income
of $105 million and net income of $28 million in the fourth quarter of 2010.
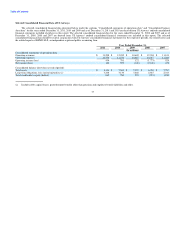
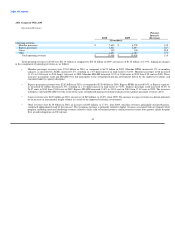
Revenue
Mainline and Express passenger revenues increased $1.10 billion, or 10.5%, in 2011 as compared to 2010. The increase in passenger revenues was
driven by a 7.8% increase in yield as compared to 2010. Our mainline and Express passenger revenue per available seat mile ("PRASM") was 13.34 cents in
2011, a 9.4% increase as compared to 12.20 cents in 2010. Total revenue per available seat mile ("RASM") was 15.06 cents in 2011 as compared to 13.88
cents in 2010, representing an 8.5% improvement. Total revenues include our ancillary revenue initiatives, which generated $537 million in revenues for
2011, an increase of $23 million over 2010.
Fuel
The average mainline and Express price per gallon of fuel was $3.11 in 2011 as compared to an average cost per gallon of $2.25 in 2010, an increase of
38.2%. Accordingly, our mainline and Express fuel expense was $4.46 billion in 2011, which was $1.28 billion, or 40.5%, higher than 2010 on a 1.0%
increase in total system capacity.
Since the third quarter of 2008, we have not entered into any new transactions to hedge our fuel consumption, and we have not had any fuel hedging
contracts outstanding since the third quarter of 2009.
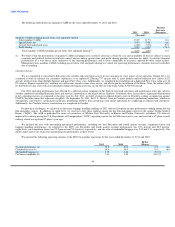
Capacity
We maintained our capacity discipline in 2011. Total system capacity was up 1.0% versus 2010. For full year 2012, total system capacity is presently
expected to be up approximately one percent versus 2011. Domestic capacity is presently expected to be up slightly and international up approximately three
percent.
Cost Control
We remain committed to maintaining a low cost structure, which we believe is necessary in an industry whose economic prospects are heavily
dependent upon two variables we cannot control: the health of the economy and the price of fuel. Our mainline costs per available seat mile ("CASM")
excluding special items, fuel and profit sharing increased 0.05 cents, or 0.6%, from 8.30 cents in 2010 to 8.35 cents in 2011.
39