US Airways 2011 Annual Report Download - page 51
Download and view the complete annual report
Please find page 51 of the 2011 US Airways annual report below. You can navigate through the pages in the report by either clicking on the pages listed below, or by using the keyword search tool below to find specific information within the annual report.-
 1
1 -
2
-
3
-
4
-
5
-
6
-
7
-
8
-
9
-
10
-
11
-
12
-
13
-
14
-
15
-
16
-
17
-
18
-
19
-
20
-
21
-
22
-
23
-
24
-
25
-
26
-
27
-
28
-
29
-
30
-
31
-
32
-
33
-
34
-
35
-
36
-
37
-
38
-
39
-
40
-
 41
41 -
 42
42 -
 43
43 -
 44
44 -
 45
45 -
 46
46 -
 47
47 -
 48
48 -
 49
49 -
 50
50 -
 51
51 -
 52
52 -
 53
53 -
 54
54 -
 55
55 -
 56
56 -
 57
57 -
 58
58 -
 59
59 -
 60
60 -
 61
61 -
62
-
63
-
64
-
65
-
66
-
67
-
68
-
69
-
70
-
71
-
72
-
73
-
74
-
75
-
76
-
77
-
78
-
79
-
80
-
81
-
82
-
83
-
84
-
85
-
86
-
87
-
88
-
89
-
90
-
91
-
92
-
93
-
94
-
95
-
96
-
97
-
98
-
99
-
100
-
101
-
102
-
103
-
104
-
105
-
106
-
107
-
108
-
109
-
110
-
111
-
112
-
113
-
114
-
115
-
116
-
117
-
118
-
119
-
120
-
121
-
122
-
123
-
124
-
125
-
126
-
127
-
128
-
129
-
130
-
131
-
132
-
133
-
134
-
135
-
136
-
137
-
138
-
139
-
140
-
141
-
142
-
143
-
144
-
145
-
146
-
147
-
148
-
149
-
150
-
151
-
152
-
153
-
154
-
155
-
156
-
157
-
158
-
159
-
160
-
161
-
162
-
163
-
164
-
165
-
166
-
167
-
168
-
169
-
170
-
171
 |
 |

Table of Contents
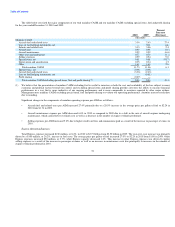
Significant changes in the components of mainline operating expense per ASM are as follows:
• Aircraft fuel and related taxes per ASM increased 39.5% primarily due to a 38.7% increase in the average price per gallon of fuel to $3.11 in
2011 from $2.24 in 2010.
• Selling expenses per ASM increased 6.2% primarily due to higher credit card fees as a result of the increase in passenger revenues in 2011.
• Depreciation and amortization expense per ASM decreased 5.8% primarily due to a significant portion of merger-related property and equipment
additions becoming fully amortized and not subject to further depreciation expense in the 2011 period as well as a 1.4% increase in capacity.
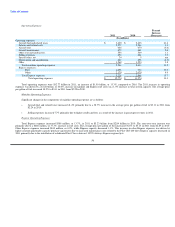
Express Operating Expenses:
Total Express expenses increased $398 million, or 14.6%, in 2011 to $3.13 billion from $2.73 billion in 2010. The year-over-year increase was
primarily due to a $287 million, or 37.4%, increase in fuel costs. The average price per gallon of fuel increased 36.7% to $3.12 in 2011 from $2.29 in 2010.
Other Express expenses increased $111 million, or 5.6%, while Express capacity decreased 1.1%. This increase in other Express expenses was driven by a
$99 million increase in maintenance costs related to the PSA CRJ-200 fleet. Express capacity decreased in 2011 primarily due to the installation of a
dedicated First Class cabin on 110 US Airways Express regional jets.
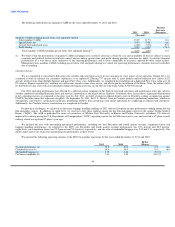
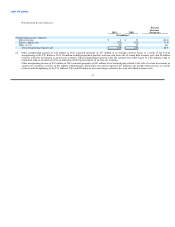
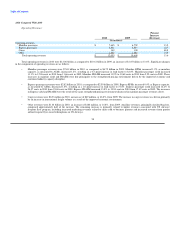
Nonoperating Income (Expense):
Percent
Increase
2011 2010 (Decrease)
(In millions)
Nonoperating income (expense):
Interest income $ 4 $ 13 (66.6)
Interest expense, net (327) (329) (0.5)
Other, net (a) (13) 37 nm
Total nonoperating expense, net $ (336) $ (279) 20.8
(a) Other nonoperating expense of $13 million in 2011 consisted primarily of $17 million in net foreign currency losses as a result of the overall
strengthening of the U.S. dollar in 2011, $6 million in debt prepayment penalties and non-cash write offs of certain debt issuance costs and $2 million
of losses related to investments in auction rate securities. These nonoperating expenses in the 2011 period were offset in part by a $15 million credit in
connection with an award received in an arbitration involving investments in auction rate securities.
Other nonoperating income of $37 million in 2010 consisted primarily of $53 million of net realized gains related to the sale of certain investments in
auction rate securities as well as an $11 million settlement gain. These gains were offset in part by $17 million in net foreign currency losses as a result
of the overall strengthening of the U.S. dollar in 2010 and $5 million in non-cash charges related to the write off of debt issuance costs.
48