US Airways 2011 Annual Report Download - page 115
Download and view the complete annual report
Please find page 115 of the 2011 US Airways annual report below. You can navigate through the pages in the report by either clicking on the pages listed below, or by using the keyword search tool below to find specific information within the annual report.-
 1
1 -
2
-
3
-
4
-
5
-
6
-
7
-
8
-
9
-
10
-
11
-
12
-
13
-
14
-
15
-
16
-
17
-
18
-
19
-
20
-
21
-
22
-
23
-
24
-
25
-
26
-
27
-
28
-
29
-
30
-
31
-
32
-
33
-
34
-
35
-
36
-
37
-
38
-
39
-
40
-
41
-
42
-
43
-
44
-
45
-
46
-
47
-
48
-
49
-
50
-
51
-
52
-
53
-
54
-
55
-
56
-
57
-
58
-
59
-
60
-
61
-
62
-
63
-
64
-
65
-
66
-
67
-
68
-
69
-
70
-
71
-
72
-
73
-
74
-
75
-
76
-
77
-
78
-
79
-
80
-
81
-
82
-
83
-
84
-
85
-
86
-
87
-
88
-
89
-
90
-
91
-
92
-
93
-
94
-
95
-
96
-
97
-
98
-
99
-
100
-
101
-
102
-
103
-
104
-
 105
105 -
 106
106 -
 107
107 -
 108
108 -
 109
109 -
 110
110 -
 111
111 -
 112
112 -
 113
113 -
 114
114 -
 115
115 -
 116
116 -
 117
117 -
 118
118 -
 119
119 -
 120
120 -
 121
121 -
 122
122 -
 123
123 -
 124
124 -
 125
125 -
126
-
127
-
128
-
129
-
130
-
131
-
132
-
133
-
134
-
135
-
136
-
137
-
138
-
139
-
140
-
141
-
142
-
143
-
144
-
145
-
146
-
147
-
148
-
149
-
150
-
151
-
152
-
153
-
154
-
155
-
156
-
157
-
158
-
159
-
160
-
161
-
162
-
163
-
164
-
165
-
166
-
167
-
168
-
169
-
170
-
171
 |
 |

Table of Contents
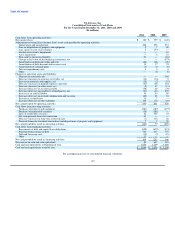
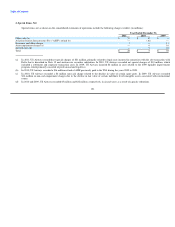
US Airways, Inc.
Consolidated Statements of Cash Flows
For the Years Ended December 31, 2011, 2010 and 2009
(In millions)
2011 2010 2009
Cash flows from operating activities:
Net income (loss) $ 180 $ 599 $ (140)
Adjustments to reconcile net income (loss) to net cash provided by operating activities:
Depreciation and amortization 248 258 251
Loss on dispositions of property and equipment 8 7 60
Loss (gain) on sale of investments 2 (53) —
Auction rate security impairment — — 10
Asset impairment — 6 18
Non-cash tax provision (benefit) 21 — (24)
Change in fair value of fuel hedging instruments, net — — (375)
Amortization of deferred credits and rent (46) (46) (49)
Amortization of debt discount and issuance costs 14 17 23
Amortization of actuarial gains (3) (4) (6)
Debt extinguishment costs 3 5 6
Other — (2) (8)
Changes in operating assets and liabilities:
Decrease in restricted cash — — 186
Decrease (increase) in accounts receivable, net (16) (34) 9
Increase in materials and supplies, net (15) (2) (25)
Decrease (increase) in prepaid expenses and other (47) (41) 164
Decrease (increase) in other assets, net (2) 17 (13)
Increase (decrease) in accounts payable (38) 29 (79)
Increase (decrease) in payables to related parties, net (27) (16) 257
Increase in air traffic liability 49 83 80
Increase (decrease) in accrued compensation and vacation (69) 65 24
Increase in accrued taxes 16 7 —
Increase (decrease) in other liabilities 162 (74) (43)
Net cash provided by operating activities 440 821 326
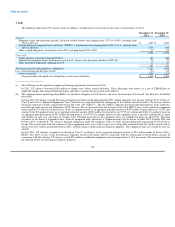
Cash flows from investing activities:
Purchases of property and equipment (581) (187) (677)
Purchases of marketable securities (30) (180) —
Sales of marketable securities 82 325 52
Net cash proceeds from slot transaction 63 — —
Decrease (increase) in long-term restricted cash (1) 116 60
Proceeds from sale-leaseback transactions and dispositions of property and equipment 7 3 76
Net cash provided by (used in) investing activities (460) 77 (489)
Cash flows from financing activities:
Repayments of debt and capital lease obligations (659) (679) (391)
Proceeds from issuance of debt 764 437 747
Deferred financing costs (14) (9) (10)
Other 13 — —
Net cash provided by (used in) financing activities 104 (251) 346
Net increase in cash and cash equivalents 84 647 183
Cash and cash equivalents at beginning of year 1,856 1,209 1,026
Cash and cash equivalents at end of year $ 1,940 $ 1,856 $ 1,209
See accompanying notes to consolidated financial statements.
112