US Airways 2011 Annual Report Download - page 55
Download and view the complete annual report
Please find page 55 of the 2011 US Airways annual report below. You can navigate through the pages in the report by either clicking on the pages listed below, or by using the keyword search tool below to find specific information within the annual report.-
 1
1 -
2
-
3
-
4
-
5
-
6
-
7
-
8
-
9
-
10
-
11
-
12
-
13
-
14
-
15
-
16
-
17
-
18
-
19
-
20
-
21
-
22
-
23
-
24
-
25
-
26
-
27
-
28
-
29
-
30
-
31
-
32
-
33
-
34
-
35
-
36
-
37
-
38
-
39
-
40
-
41
-
42
-
43
-
44
-
 45
45 -
 46
46 -
 47
47 -
 48
48 -
 49
49 -
 50
50 -
 51
51 -
 52
52 -
 53
53 -
 54
54 -
 55
55 -
 56
56 -
 57
57 -
 58
58 -
 59
59 -
 60
60 -
 61
61 -
 62
62 -
 63
63 -
 64
64 -
 65
65 -
66
-
67
-
68
-
69
-
70
-
71
-
72
-
73
-
74
-
75
-
76
-
77
-
78
-
79
-
80
-
81
-
82
-
83
-
84
-
85
-
86
-
87
-
88
-
89
-
90
-
91
-
92
-
93
-
94
-
95
-
96
-
97
-
98
-
99
-
100
-
101
-
102
-
103
-
104
-
105
-
106
-
107
-
108
-
109
-
110
-
111
-
112
-
113
-
114
-
115
-
116
-
117
-
118
-
119
-
120
-
121
-
122
-
123
-
124
-
125
-
126
-
127
-
128
-
129
-
130
-
131
-
132
-
133
-
134
-
135
-
136
-
137
-
138
-
139
-
140
-
141
-
142
-
143
-
144
-
145
-
146
-
147
-
148
-
149
-
150
-
151
-
152
-
153
-
154
-
155
-
156
-
157
-
158
-
159
-
160
-
161
-
162
-
163
-
164
-
165
-
166
-
167
-
168
-
169
-
170
-
171
 |
 |

Table of Contents
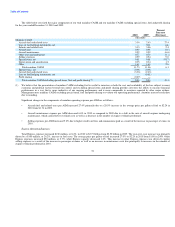
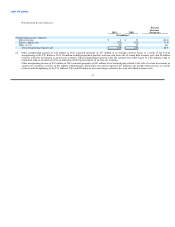
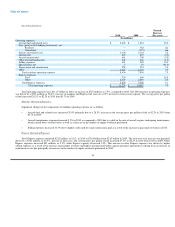
Nonoperating Income (Expense):
Percent
Increase
2010 2009 (Decrease)
(In millions)
Nonoperating income (expense):
Interest income $ 13 $ 24 (46.3)
Interest expense, net (a) (329) (304) 8.2
Other, net (b) 37 (81) nm
Total nonoperating expense, net $ (279) $ (361) (22.9)
(a) Interest expense, net increased $25 million due to an increase in the average debt balance outstanding in 2010 primarily as a result of liquidity raising
initiatives completed throughout 2009.
(b) Other nonoperating income of $37 million in 2010 consisted primarily of $53 million of net realized gains related to the sale of certain investments in
auction rate securities as well as an $11 million settlement gain. These gains were offset in part by $17 million in net foreign currency losses as a result
of the overall strengthening of the U.S. dollar in 2010 and $5 million in non-cash charges related to the write off of debt issuance costs.
Other nonoperating expense of $81 million in 2009 consisted primarily of $49 million in non-cash charges associated with the sale of 10 Embraer 190
aircraft and write off of related debt discount and issuance costs, a $14 million loss on the sale of certain aircraft equipment, $10 million in other-than-
temporary non-cash impairment charges for investments in auction rate securities, $3 million in foreign currency losses and a $2 million non-cash asset
impairment charge.
52