US Airways 2011 Annual Report Download - page 114
Download and view the complete annual report
Please find page 114 of the 2011 US Airways annual report below. You can navigate through the pages in the report by either clicking on the pages listed below, or by using the keyword search tool below to find specific information within the annual report.-
 1
1 -
2
-
3
-
4
-
5
-
6
-
7
-
8
-
9
-
10
-
11
-
12
-
13
-
14
-
15
-
16
-
17
-
18
-
19
-
20
-
21
-
22
-
23
-
24
-
25
-
26
-
27
-
28
-
29
-
30
-
31
-
32
-
33
-
34
-
35
-
36
-
37
-
38
-
39
-
40
-
41
-
42
-
43
-
44
-
45
-
46
-
47
-
48
-
49
-
50
-
51
-
52
-
53
-
54
-
55
-
56
-
57
-
58
-
59
-
60
-
61
-
62
-
63
-
64
-
65
-
66
-
67
-
68
-
69
-
70
-
71
-
72
-
73
-
74
-
75
-
76
-
77
-
78
-
79
-
80
-
81
-
82
-
83
-
84
-
85
-
86
-
87
-
88
-
89
-
90
-
91
-
92
-
93
-
94
-
95
-
96
-
97
-
98
-
99
-
100
-
101
-
102
-
103
-
 104
104 -
 105
105 -
 106
106 -
 107
107 -
 108
108 -
 109
109 -
 110
110 -
 111
111 -
 112
112 -
 113
113 -
 114
114 -
 115
115 -
 116
116 -
 117
117 -
 118
118 -
 119
119 -
 120
120 -
 121
121 -
 122
122 -
 123
123 -
 124
124 -
125
-
126
-
127
-
128
-
129
-
130
-
131
-
132
-
133
-
134
-
135
-
136
-
137
-
138
-
139
-
140
-
141
-
142
-
143
-
144
-
145
-
146
-
147
-
148
-
149
-
150
-
151
-
152
-
153
-
154
-
155
-
156
-
157
-
158
-
159
-
160
-
161
-
162
-
163
-
164
-
165
-
166
-
167
-
168
-
169
-
170
-
171
 |
 |
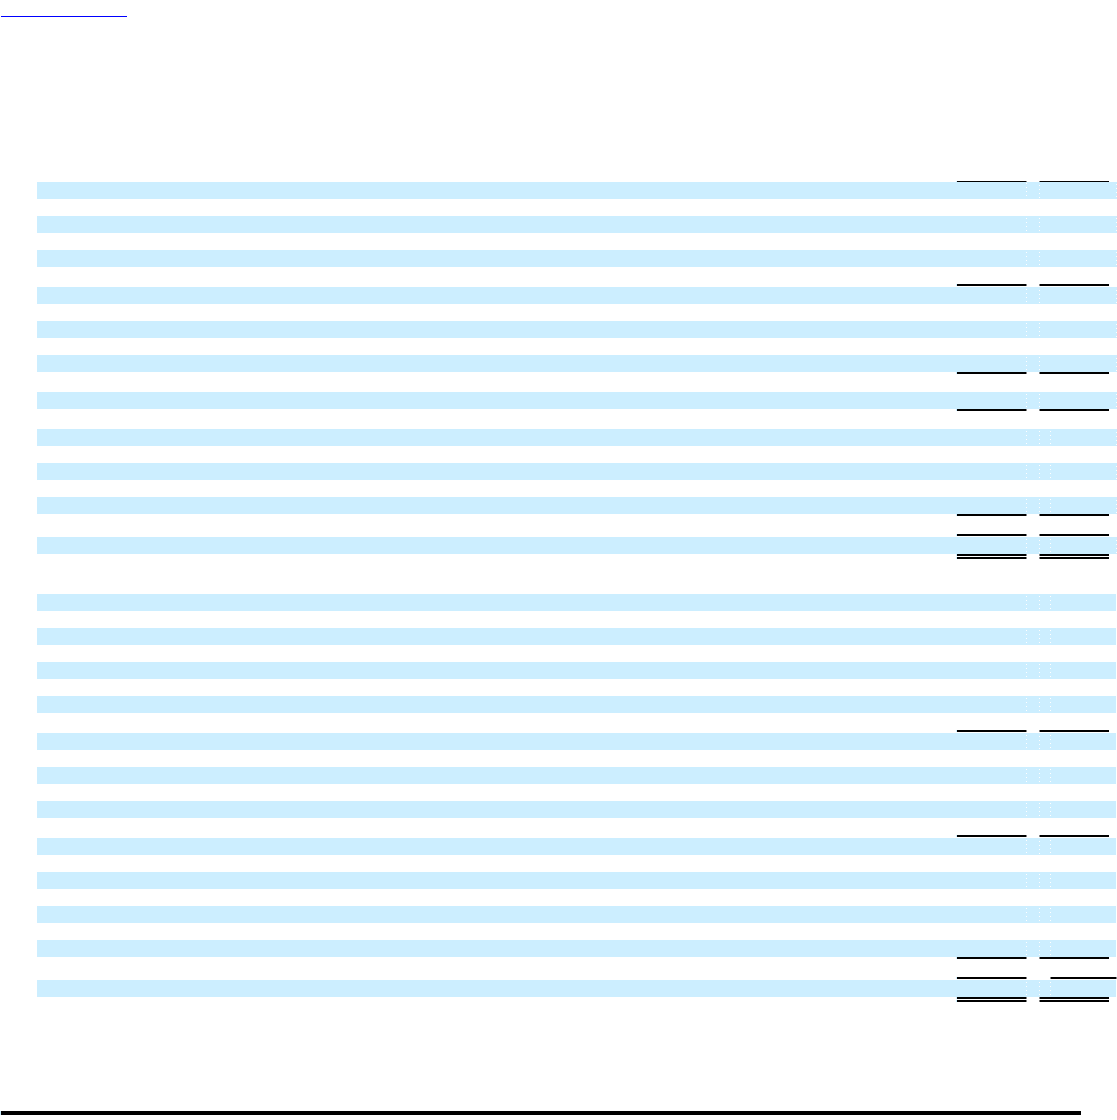
Table of Contents
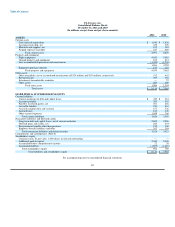
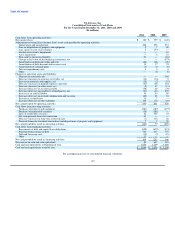
US Airways, Inc.
Consolidated Balance Sheets
December 31, 2011 and 2010
(In millions, except share and per share amounts)
2011 2010
ASSETS
Current assets
Cash and cash equivalents $ 1,940 $ 1,856
Accounts receivable, net 325 309
Materials and supplies, net 199 184
Prepaid expenses and other 527 480
Total current assets 2,991 2,829
Property and equipment
Flight equipment 4,441 3,985
Ground property and equipment 873 812
Less accumulated depreciation and amortization (1,428) (1,238)
3,886 3,559
Equipment purchase deposits 153 123
Total property and equipment 4,039 3,682
Other assets
Other intangibles, net of accumulated amortization of $124 million and $130 million, respectively 512 443
Restricted cash 365 364
Investments in marketable securities — 57
Other assets 209 190
Total other assets 1,086 1,054
Total assets $ 8,116 $ 7,565
LIABILITIES & STOCKHOLDER'S EQUITY
Current liabilities
Current maturities of debt and capital leases $ 420 $ 381
Accounts payable 305 343
Payables to related parties, net 601 626
Air traffic liability 910 861
Accrued compensation and vacation 167 236
Accrued taxes 165 149
Other accrued expenses 1,058 766
Total current liabilities 3,626 3,362
Noncurrent liabilities and deferred credits
Long-term debt and capital leases, net of current maturities 2,698 2,596
Deferred gains and credits, net 280 293
Postretirement benefits other than pensions 158 140
Employee benefit liabilities and other 392 394
Total noncurrent liabilities and deferred credits 3,528 3,423
Commitments and contingencies (Note 8)
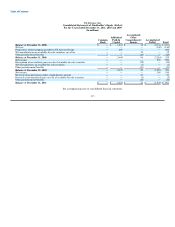
Stockholder's equity
Common stock, $1 par value, 1,000 shares issued and outstanding — —
Additional paid-in capital 2,445 2,445
Accumulated other comprehensive income 22 20
Accumulated deficit (1,505) (1,685)
Total stockholder's equity 962 780
Total liabilities and stockholder's equity $ 8,116 $ 7,565
See accompanying notes to consolidated financial statements.
111