Time Warner Cable 2007 Annual Report Download - page 68
Download and view the complete annual report
Please find page 68 of the 2007 Time Warner Cable annual report below. You can navigate through the pages in the report by either clicking on the pages listed below, or by using the keyword search tool below to find specific information within the annual report.-
 1
1 -
2
-
3
-
4
-
5
-
6
-
7
-
8
-
9
-
10
-
11
-
12
-
13
-
14
-
15
-
16
-
17
-
18
-
19
-
20
-
21
-
22
-
23
-
24
-
25
-
26
-
27
-
28
-
29
-
30
-
31
-
32
-
33
-
34
-
35
-
36
-
37
-
38
-
39
-
40
-
41
-
42
-
43
-
44
-
45
-
46
-
47
-
48
-
49
-
50
-
51
-
52
-
53
-
54
-
55
-
56
-
57
-
 58
58 -
 59
59 -
 60
60 -
 61
61 -
 62
62 -
 63
63 -
 64
64 -
 65
65 -
 66
66 -
 67
67 -
 68
68 -
 69
69 -
 70
70 -
 71
71 -
 72
72 -
 73
73 -
 74
74 -
 75
75 -
 76
76 -
 77
77 -
 78
78 -
79
-
80
-
81
-
82
-
83
-
84
-
85
-
86
-
87
-
88
-
89
-
90
-
91
-
92
-
93
-
94
-
95
-
96
-
97
-
98
-
99
-
100
-
101
-
102
-
103
-
104
-
105
-
106
-
107
-
108
-
109
-
110
-
111
-
112
-
113
-
114
-
115
-
116
-
117
-
118
-
119
-
120
-
121
-
122
-
123
-
124
-
125
-
126
-
127
-
128
-
129
-
130
-
131
-
132
-
133
-
134
-
135
-
136
-
137
-
138
-
139
-
140
-
141
-
142
-
143
-
144
-
145
-
146
-
147
-
148
-
149
 |
 |

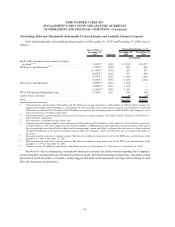
Cumulative effect of accounting change, net of tax. In 2006, the Company recorded a benefit of $2 million,
net of tax, as the cumulative effect of a change in accounting principle upon the adoption of FAS 123R, to recognize
the effect of estimating the number of Time Warner equity-based awards granted to TWC employees prior to
January 1, 2006 that are not ultimately expected to vest.
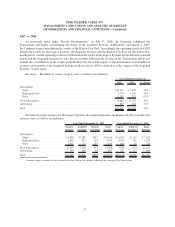
Net income and Net income per common share. Net income was $1.976 billion in 2006 compared to
$1.253 billion in 2005. Basic and diluted net income per common share were $2.00 in 2006 compared to $1.25 in
2005.
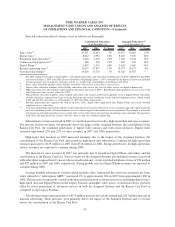
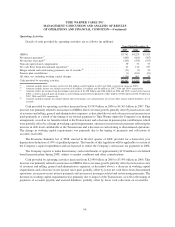
FINANCIAL CONDITION AND LIQUIDITY
Management believes that cash generated by or available to TWC should be sufficient to fund its capital and
liquidity needs for the foreseeable future. TWC’s sources of cash include cash provided by operating activities, cash
and equivalents on hand, available borrowing capacity under its committed credit facilities and commercial paper
program and access to the capital markets. TWC’s unused committed available funds were $3.881 billion as of
December 31, 2007, including $232 million in cash and equivalents and $3.649 billion of available borrowing
capacity under the Company’s $6.0 billion senior unsecured five-year revolving credit facility.
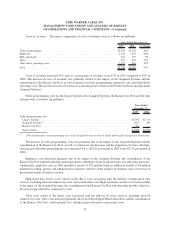
Current Financial Condition
As of December 31, 2007, the Company had $13.577 billion of debt, $232 million of cash and equivalents (net
debt of $13.345 billion, defined as total debt less cash and equivalents), $300 million of mandatorily redeemable
non-voting Series A Preferred Membership Units issued by TW NY in connection with the Adelphia Acquisition
(the “TW NY Preferred Membership Units”) and $24.706 billion of shareholders’ equity. As of December 31, 2006,
the Company had $14.432 billion of debt, $51 million of cash and equivalents (net debt of $14.381 billion),
$300 million of TW NY Preferred Membership Units and $23.564 billion of shareholders’ equity.
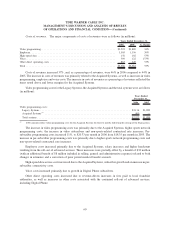
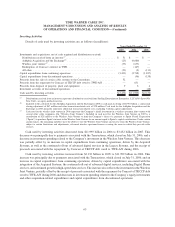
The following table shows the significant items contributing to the decrease in net debt from December 31,
2006 to December 31, 2007 (in millions):
Balance as of December 31, 2006
(a)
...................................................... $14,381
Cash provided by operating activities . . . . . . . . . . . . . . . . . . . . . . . . . . . . . . . . . . . . . . . . . . . . . . . . . . . . . (4,563)
Capital expenditures . . . . . . . . . . . . . . . . . . . . . . . . . . . . . . . . . . . . . . . . . . . . . . . . . . . . . . . . . . . . . . . . . 3,433
Proceeds from the sale of certain cable systems to the Consortium . . . . . . . . . . . . . . . . . . . . . . . . . . . . . . . . . (52)
All other, net . . . . . . . . . . . . . . . . . . . . . . . . . . . . . . . . . . . . . . . . . . . . . . . . . . . . . . . . . . . . . . . . . . . . . . 146
Balance as of December 31, 2007
(a)
...................................................... $13,345
(a)
Amounts include unamortized fair value adjustments of $126 million and $140 million as of December 31, 2007 and 2006, respectively,
which were recognized as a result of the merger of America Online, Inc. (now known as AOL LLC) and Time Warner Inc. (now known as
Historic TW Inc.).
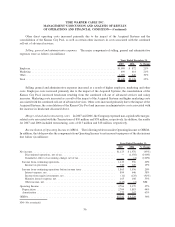
Cash Flows
Cash and equivalents increased by $181 million and $39 million in 2007 and 2006, respectively, and decreased
by $90 million in 2005. Components of these changes are discussed below in more detail.
63
TIME WARNER CABLE INC.
MANAGEMENT’S DISCUSSION AND ANALYSIS OF RESULTS
OF OPERATIONS AND FINANCIAL CONDITION—(Continued)