Time Warner Cable 2007 Annual Report Download - page 59
Download and view the complete annual report
Please find page 59 of the 2007 Time Warner Cable annual report below. You can navigate through the pages in the report by either clicking on the pages listed below, or by using the keyword search tool below to find specific information within the annual report.-
 1
1 -
2
-
3
-
4
-
5
-
6
-
7
-
8
-
9
-
10
-
11
-
12
-
13
-
14
-
15
-
16
-
17
-
18
-
19
-
20
-
21
-
22
-
23
-
24
-
25
-
26
-
27
-
28
-
29
-
30
-
31
-
32
-
33
-
34
-
35
-
36
-
37
-
38
-
39
-
40
-
41
-
42
-
43
-
44
-
45
-
46
-
47
-
48
-
 49
49 -
 50
50 -
 51
51 -
 52
52 -
 53
53 -
 54
54 -
 55
55 -
 56
56 -
 57
57 -
 58
58 -
 59
59 -
 60
60 -
 61
61 -
 62
62 -
 63
63 -
 64
64 -
 65
65 -
 66
66 -
 67
67 -
 68
68 -
 69
69 -
70
-
71
-
72
-
73
-
74
-
75
-
76
-
77
-
78
-
79
-
80
-
81
-
82
-
83
-
84
-
85
-
86
-
87
-
88
-
89
-
90
-
91
-
92
-
93
-
94
-
95
-
96
-
97
-
98
-
99
-
100
-
101
-
102
-
103
-
104
-
105
-
106
-
107
-
108
-
109
-
110
-
111
-
112
-
113
-
114
-
115
-
116
-
117
-
118
-
119
-
120
-
121
-
122
-
123
-
124
-
125
-
126
-
127
-
128
-
129
-
130
-
131
-
132
-
133
-
134
-
135
-
136
-
137
-
138
-
139
-
140
-
141
-
142
-
143
-
144
-
145
-
146
-
147
-
148
-
149
 |
 |

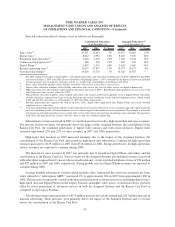
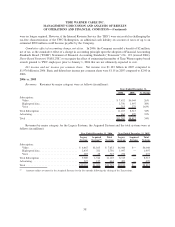
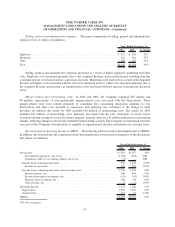
Selected subscriber-related statistics were as follows (in thousands):
2007 2006 % Change 2007 2006 % Change
Consolidated Subscribers
as of December 31,
Managed Subscribers
(a)
as of December 31,
Basic video
(b)
. . . . . . . . . . . . . . . . . . . . . . . . . . . . . . 13,251 12,614 5% 13,251 13,402 (1%)
Digital video
(c)
. . . . . . . . . . . . . . . . . . . . . . . . . . . . . 8,022 6,938 16% 8,022 7,270 10%
Residential high-speed data
(d)
. . . . . . . . . . . . . . . . . . . 7,620 6,270 22% 7,620 6,644 15%
Commercial high-speed data
(d)
. . . . . . . . . . . . . . . . . . 280 230 22% 280 245 14%
Digital Phone
(e)
. . . . . . . . . . . . . . . . . . . . . . . . . . . . 2,895 1,719 68% 2,895 1,860 56%
Revenue generating units
(f)
. . . . . . . . . . . . . . . . . . . . 32,077 27,877 15% 32,077 29,527 9%
Customer relationships
(g)
. . . . . . . . . . . . . . . . . . . . . . 14,626 13,710 7% 14,626 14,565 —
(a)
For 2006, managed subscribers included TWC’s consolidated subscribers and subscribers in the Kansas City Pool of TKCCP, which TWC
received on January 1, 2007 in the TKCCP asset distribution. Beginning January 1, 2007, subscribers in the Kansas City Pool are included
in both managed and consolidated subscriber results as a result of the consolidation of the Kansas City Pool.
(b)
Basic video subscriber numbers reflect billable subscribers who receive at least basic video service.
(c)
Digital video subscriber numbers reflect billable subscribers who receive any level of video service via digital transmissions.
(d)
High-speed data subscriber numbers reflect billable subscribers who receive TWC’s Road Runner high-speed data service or any of the
other high-speed data services offered by TWC.
(e)
Digital Phone subscriber numbers reflect billable subscribers who receive an IP-based telephony service. Digital Phone subscribers
exclude subscribers acquired from Comcast in the Exchange who receive traditional, circuit-switched telephone service (which totaled
9,000 and 106,000 subscribers as of December 31, 2007 and 2006, respectively).
(f)
Revenue generating units represent the total of all basic video, digital video, high-speed data, Digital Phone and circuit-switched
telephone service subscribers.
(g)
Customer relationships represent the number of subscribers that receive at least one level of service, encompassing video, high-speed data
and voice (including circuit-switched telephone) services, without regard to the number of services purchased. For example, a subscriber
who purchases only high-speed data service and no video service will count as one customer relationship, and a subscriber who purchases
both video and high-speed data services will also count as only one customer relationship.
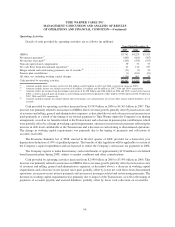
Subscription revenues increased in 2007 as a result of increases in video, high-speed data and voice revenues.
The increase in video revenues was primarily due to the impact of the Acquired Systems, the consolidation of the
Kansas City Pool, the continued penetration of digital video services and video price increases. Digital video
revenues represented 23% and 22% of video revenues in 2007 and 2006, respectively.
High-speed data revenues in 2007 increased primarily due to the impact of the Acquired Systems, the
consolidation of the Kansas City Pool and growth in high-speed data subscribers. Commercial high-speed data
revenues increased to $435 million in 2007 from $318 million in 2006. Strong growth rates for high-speed data
service revenues are expected to continue during 2008.
The increase in voice revenues in 2007 was primarily due to growth in Digital Phone subscribers and the
consolidation of the Kansas City Pool. Voice revenues for the Acquired Systems also included revenues associated
with subscribers acquired from Comcast who received traditional, circuit-switched telephone service of $34 million
and $27 million in 2007 and 2006, respectively. Strong growth rates for Digital Phone revenues are expected to
continue during 2008.
Average monthly subscription revenue (which includes video, high-speed data and voice revenues) per basic
video subscriber (“subscription ARPU”) increased 4% to approximately $94 in 2007 from approximately $90 in
2006. This increase was primarily a result of the increased penetration of advanced services (including digital video,
high-speed data and Digital Phone) in the Legacy Systems and higher video prices, as discussed above, partially
offset by lower penetration of advanced services in both the Acquired Systems and the Kansas City Pool as
compared to the Legacy Systems.
Advertising revenues increased due to a $176 million increase in local advertising and a $27 million increase in
national advertising. These increases were primarily due to the impact of the Acquired Systems and, to a lesser
extent, the consolidation of the Kansas City Pool.
54
TIME WARNER CABLE INC.
MANAGEMENT’S DISCUSSION AND ANALYSIS OF RESULTS
OF OPERATIONS AND FINANCIAL CONDITION—(Continued)