Time Warner Cable 2007 Annual Report Download - page 66
Download and view the complete annual report
Please find page 66 of the 2007 Time Warner Cable annual report below. You can navigate through the pages in the report by either clicking on the pages listed below, or by using the keyword search tool below to find specific information within the annual report.-
 1
1 -
2
-
3
-
4
-
5
-
6
-
7
-
8
-
9
-
10
-
11
-
12
-
13
-
14
-
15
-
16
-
17
-
18
-
19
-
20
-
21
-
22
-
23
-
24
-
25
-
26
-
27
-
28
-
29
-
30
-
31
-
32
-
33
-
34
-
35
-
36
-
37
-
38
-
39
-
40
-
41
-
42
-
43
-
44
-
45
-
46
-
47
-
48
-
49
-
50
-
51
-
52
-
53
-
54
-
55
-
 56
56 -
 57
57 -
 58
58 -
 59
59 -
 60
60 -
 61
61 -
 62
62 -
 63
63 -
 64
64 -
 65
65 -
 66
66 -
 67
67 -
 68
68 -
 69
69 -
 70
70 -
 71
71 -
 72
72 -
 73
73 -
 74
74 -
 75
75 -
 76
76 -
77
-
78
-
79
-
80
-
81
-
82
-
83
-
84
-
85
-
86
-
87
-
88
-
89
-
90
-
91
-
92
-
93
-
94
-
95
-
96
-
97
-
98
-
99
-
100
-
101
-
102
-
103
-
104
-
105
-
106
-
107
-
108
-
109
-
110
-
111
-
112
-
113
-
114
-
115
-
116
-
117
-
118
-
119
-
120
-
121
-
122
-
123
-
124
-
125
-
126
-
127
-
128
-
129
-
130
-
131
-
132
-
133
-
134
-
135
-
136
-
137
-
138
-
139
-
140
-
141
-
142
-
143
-
144
-
145
-
146
-
147
-
148
-
149
 |
 |

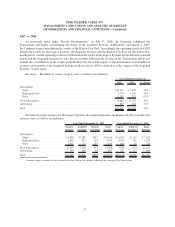
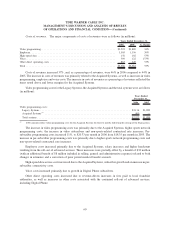
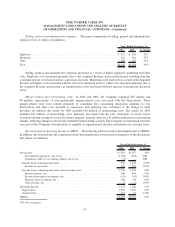
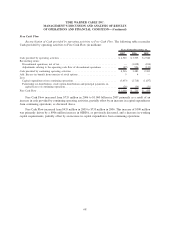
Selling, general and administrative expenses. The major components of selling, general and administrative
expenses were as follows (in millions):
2006 2005 % Change
Years Ended December 31,
Employee. . . . . . . . . . . . . . . . . . . . . . . . . . . . . . . . . . . . . . . . . . . . . . . . . . . . . . . . . $ 872 $ 678 29%
Marketing . . . . . . . . . . . . . . . . . . . . . . . . . . . . . . . . . . . . . . . . . . . . . . . . . . . . . . . . 414 306 35%
Other . . . . . . . . . . . . . . . . . . . . . . . . . . . . . . . . . . . . . . . . . . . . . . . . . . . . . . . . . . . . 840 545 54%
Total . . . . . . . . . . . . . . . . . . . . . . . . . . . . . . . . . . . . . . . . . . . . . . . . . . . . . . . . . . . . $2,126 $1,529 39%
Selling, general and administrative expenses increased as a result of higher employee, marketing and other
costs. Employee costs increased primarily due to the Acquired Systems, increased headcount resulting from the
continued roll-out of advanced services and salary increases. Marketing costs increased as a result of the Acquired
Systems and higher costs associated with the roll-out of advanced services. Other costs increased primarily due to
the Acquired Systems and increases in administrative costs associated with the increase in headcount discussed
above.
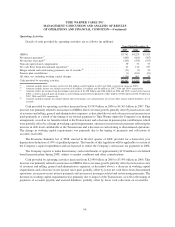
Merger-related and restructuring costs. In 2006 and 2005, the Company expensed $38 million and
$8 million, respectively, of non-capitalizable merger-related costs associated with the Transactions. These
merger-related costs were related primarily to consulting fees concerning integration planning for the
Transactions and other costs incurred in connection with notifying new customers of the change in cable
providers. In addition, the results for 2006 included $18 million of restructuring costs. The results for 2005
included $35 million of restructuring costs, primarily associated with the early retirement of certain senior
executives and the closing of several local news channels, partially offset by a $1 million reduction in restructuring
charges, reflecting changes to previously established restructuring accruals. The Company’s restructuring activities
were part of the Company’s broader plans to simplify its organizational structure and enhance its customer focus.
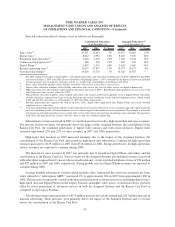
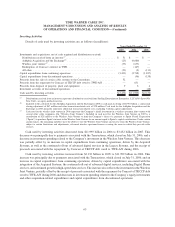
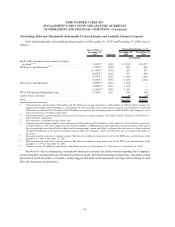
Reconciliation of Operating Income to OIBDA. The following table reconciles Operating Income to OIBDA.
In addition, the table provides the components from Operating Income to net income for purposes of the discussions
that follow (in millions):
2006 2005 % Change
Years Ended December 31,
Net income . . . . . . . . . . . . . . . . . . . . . . . . . . . . . . . . . . . . . . . . . . . . . . . . . . . . . . . $ 1,976 $1,253 58%
Discontinued operations, net of tax . . . . . . . . . . . . . . . . . . . . . . . . . . . . . . . . . . . (1,038) (104) NM
Cumulative effect of accounting change, net of tax . . . . . . . . . . . . . . . . . . . . . . . . (2) — NM
Income from continuing operations. . . . . . . . . . . . . . . . . . . . . . . . . . . . . . . . . . . . . 936 1,149 (19%)
Income tax provision . . . . . . . . . . . . . . . . . . . . . . . . . . . . . . . . . . . . . . . . . . . . . 620 153 305%
Income from continuing operations before income taxes . . . . . . . . . . . . . . . . . . . . . . 1,556 1,302 20%
Interest expense, net . . . . . . . . . . . . . . . . . . . . . . . . . . . . . . . . . . . . . . . . . . . . . 646 464 39%
Income from equity investments, net . . . . . . . . . . . . . . . . . . . . . . . . . . . . . . . . . . (129) (43) 200%
Minority interest expense, net . . . . . . . . . . . . . . . . . . . . . . . . . . . . . . . . . . . . . . . 108 64 69%
Other income, net . . . . . . . . . . . . . . . . . . . . . . . . . . . . . . . . . . . . . . . . . . . . . . . (2) (1) 100%
Operating Income . . . . . . . . . . . . . . . . . . . . . . . . . . . . . . . . . . . . . . . . . . . . . . . . . . 2,179 1,786 22%
Depreciation . . . . . . . . . . . . . . . . . . . . . . . . . . . . . . . . . . . . . . . . . . . . . . . . . . . . 1,883 1,465 29%
Amortization . . . . . . . . . . . . . . . . . . . . . . . . . . . . . . . . . . . . . . . . . . . . . . . . . . . . 167 72 132%
OIBDA . . . . . . . . . . . . . . . . . . . . . . . . . . . . . . . . . . . . . . . . . . . . . . . . . . . . . . . . . . $ 4,229 $3,323 27%
NM—Not meaningful.
61
TIME WARNER CABLE INC.
MANAGEMENT’S DISCUSSION AND ANALYSIS OF RESULTS
OF OPERATIONS AND FINANCIAL CONDITION—(Continued)