Time Warner Cable 2007 Annual Report Download - page 137
Download and view the complete annual report
Please find page 137 of the 2007 Time Warner Cable annual report below. You can navigate through the pages in the report by either clicking on the pages listed below, or by using the keyword search tool below to find specific information within the annual report.-
 1
1 -
2
-
3
-
4
-
5
-
6
-
7
-
8
-
9
-
10
-
11
-
12
-
13
-
14
-
15
-
16
-
17
-
18
-
19
-
20
-
21
-
22
-
23
-
24
-
25
-
26
-
27
-
28
-
29
-
30
-
31
-
32
-
33
-
34
-
35
-
36
-
37
-
38
-
39
-
40
-
41
-
42
-
43
-
44
-
45
-
46
-
47
-
48
-
49
-
50
-
51
-
52
-
53
-
54
-
55
-
56
-
57
-
58
-
59
-
60
-
61
-
62
-
63
-
64
-
65
-
66
-
67
-
68
-
69
-
70
-
71
-
72
-
73
-
74
-
75
-
76
-
77
-
78
-
79
-
80
-
81
-
82
-
83
-
84
-
85
-
86
-
87
-
88
-
89
-
90
-
91
-
92
-
93
-
94
-
95
-
96
-
97
-
98
-
99
-
100
-
101
-
102
-
103
-
104
-
105
-
106
-
107
-
108
-
109
-
110
-
111
-
112
-
113
-
114
-
115
-
116
-
117
-
118
-
119
-
120
-
121
-
122
-
123
-
124
-
125
-
126
-
 127
127 -
 128
128 -
 129
129 -
 130
130 -
 131
131 -
 132
132 -
 133
133 -
 134
134 -
 135
135 -
 136
136 -
 137
137 -
 138
138 -
 139
139 -
 140
140 -
 141
141 -
 142
142 -
 143
143 -
 144
144 -
 145
145 -
 146
146 -
 147
147 -
148
-
149
 |
 |

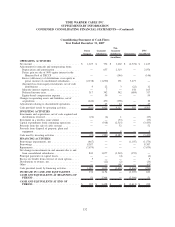
Consolidating Statement of Cash Flows
Year Ended December 31, 2007
Parent
Company
Guarantor
Subsidiaries
Non-
Guarantor
Subsidiaries Eliminations
TWC
Consolidated
(in millions)
OPERATING ACTIVITIES
Net income . . . . . . . . . . . . . . . . . . . . . . . . . . . . . . . $ 1,123 $ 772 $ 1,602 $ (2,374) $ 1,123
Adjustments for noncash and nonoperating items:
Depreciation and amortization . . . . . . . . . . . . . . . . — 657 2,319 — 2,976
Pretax gain on sale of 50% equity interest in the
Houston Pool of TKCCP . . . . . . . . . . . . . . . . . . — — (146) — (146)
Excess (deficiency) of distributions over equity in
pretax income of consolidated subsidiaries . . . . . . (2,138) (1,290) 151 3,277 —
(Income) loss from equity investments, net of cash
distributions . . . . . . . . . . . . . . . . . . . . . . . . . . . 9 22 3 (22) 12
Minority interest expense, net. . . . . . . . . . . . . . . . . — 7 — 158 165
Deferred income taxes . . . . . . . . . . . . . . . . . . . . . . 317 342 342 (684) 317
Equity-based compensation expense . . . . . . . . . . . . — 59 — — 59
Changes in operating assets and liabilities, net of
acquisitions . . . . . . . . . . . . . . . . . . . . . . . . . . . . . (242) 430 (178) — 10
Adjustments relating to discontinued operations . . . . . . — 23 24 — 47
Cash provided (used) by operating activities . . . . . . . . (931) 1,022 4,117 355 4,563
INVESTING ACTIVITIES
Investments and acquisitions, net of cash acquired and
distributions received. . . . . . . . . . . . . . . . . . . . . . . (22) (6) 1 — (27)
Investment in a wireless joint venture . . . . . . . . . . . . . — — (33) — (33)
Capital expenditures from continuing operations . . . . . — (918) (2,515) — (3,433)
Proceeds from the sale of cable systems . . . . . . . . . . . — — 52 — 52
Proceeds from disposal of property, plant and
equipment . . . . . . . . . . . . . . . . . . . . . . . . . . . . . . — 1 8 — 9
Cash used by investing activities . . . . . . . . . . . . . . . . (22) (923) (2,487) — (3,432)
FINANCING ACTIVITIES
Borrowings (repayments), net . . . . . . . . . . . . . . . . . . (467) — — (1,107) (1,574)
Borrowings . . . . . . . . . . . . . . . . . . . . . . . . . . . . . . . 8,387 — — — 8,387
Repayments . . . . . . . . . . . . . . . . . . . . . . . . . . . . . . . (7,679) — — — (7,679)
Net change in investments in and amounts due to and
from consolidated subsidiaries . . . . . . . . . . . . . . . . 841 1,077 (1,563) (355) —
Principal payments on capital leases . . . . . . . . . . . . . . — — (4) — (4)
Excess tax benefit from exercise of stock options . . . . . 5 — — — 5
Distributions to owners, net . . . . . . . . . . . . . . . . . . . . — (22) (2) — (24)
Other . . . . . . . . . . . . . . . . . . . . . . . . . . . . . . . . . . . — — (61) — (61)
Cash provided (used) by financing activities . . . . . . . . 1,087 1,055 (1,630) (1,462) (950)
INCREASE IN CASH AND EQUIVALENTS . . . . . . 134 1,154 — (1,107) 181
CASH AND EQUIVALENTS AT BEGINNING OF
PERIOD . . . . . . . . . . . . . . . . . . . . . . . . . . . . . . . 51 2,304 — (2,304) 51
CASH AND EQUIVALENTS AT END OF
PERIOD . . . . . . . . . . . . . . . . . . . . . . . . . . . . . . . $ 185 $ 3,458 $ — $ (3,411) $ 232
132
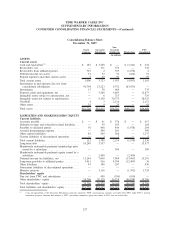
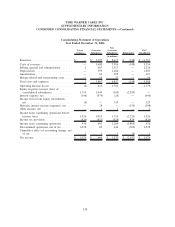
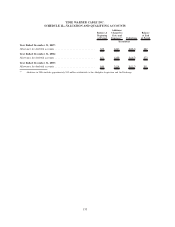
TIME WARNER CABLE INC.
SUPPLEMENTARY INFORMATION
CONDENSED CONSOLIDATING FINANCIAL STATEMENTS—(Continued)