Time Warner Cable 2007 Annual Report Download - page 67
Download and view the complete annual report
Please find page 67 of the 2007 Time Warner Cable annual report below. You can navigate through the pages in the report by either clicking on the pages listed below, or by using the keyword search tool below to find specific information within the annual report.-
 1
1 -
2
-
3
-
4
-
5
-
6
-
7
-
8
-
9
-
10
-
11
-
12
-
13
-
14
-
15
-
16
-
17
-
18
-
19
-
20
-
21
-
22
-
23
-
24
-
25
-
26
-
27
-
28
-
29
-
30
-
31
-
32
-
33
-
34
-
35
-
36
-
37
-
38
-
39
-
40
-
41
-
42
-
43
-
44
-
45
-
46
-
47
-
48
-
49
-
50
-
51
-
52
-
53
-
54
-
55
-
56
-
 57
57 -
 58
58 -
 59
59 -
 60
60 -
 61
61 -
 62
62 -
 63
63 -
 64
64 -
 65
65 -
 66
66 -
 67
67 -
 68
68 -
 69
69 -
 70
70 -
 71
71 -
 72
72 -
 73
73 -
 74
74 -
 75
75 -
 76
76 -
 77
77 -
78
-
79
-
80
-
81
-
82
-
83
-
84
-
85
-
86
-
87
-
88
-
89
-
90
-
91
-
92
-
93
-
94
-
95
-
96
-
97
-
98
-
99
-
100
-
101
-
102
-
103
-
104
-
105
-
106
-
107
-
108
-
109
-
110
-
111
-
112
-
113
-
114
-
115
-
116
-
117
-
118
-
119
-
120
-
121
-
122
-
123
-
124
-
125
-
126
-
127
-
128
-
129
-
130
-
131
-
132
-
133
-
134
-
135
-
136
-
137
-
138
-
139
-
140
-
141
-
142
-
143
-
144
-
145
-
146
-
147
-
148
-
149
 |
 |
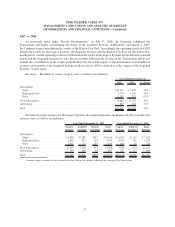
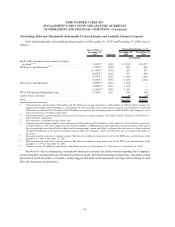
OIBDA. OIBDA increased due to the Acquired Systems and revenue growth (particularly growth in high
margin high-speed data revenues), partially offset by higher costs of revenues and selling, general and
administrative expenses, as discussed above.
Depreciation expense. Depreciation expense increased primarily due to the Acquired Systems and demand-
driven increases in recent years of purchases of customer premise equipment, which generally has a significantly
shorter useful life compared to the mix of assets previously purchased.
Amortization expense. Amortization expense increased as a result of the amortization of intangible assets
related to customer relationships associated with the Acquired Systems.
Operating Income. Operating Income increased primarily due to the increase in OIBDA, partially offset by
the increase in depreciation and amortization expense, as discussed above.
Interest expense, net. Interest expense, net, increased primarily due to an increase in debt levels attributable
to the Transactions.
Income from equity investments, net. Income from equity investments, net, increased primarily due to an
increase in the profitability of TKCCP, as well as changes in the economic benefit of TWE’s partnership interest in
TKCCP due to the then pending dissolution of the partnership triggered by Comcast on July 3, 2006. Beginning in
the third quarter of 2006, the income from TKCCP reflects 100% of the operations of the Kansas City Pool and does
not reflect any of the economic benefits of the Houston Pool. In addition, income from equity investments, net
reflects the benefit from the allocation of all the TKCCP debt to the Houston Pool, which reduced interest expense
for the Kansas City Pool.
Minority interest expense, net. Minority interest expense, net, increased primarily reflecting the change in
the ownership structure of the Company and TWE as a result of the ATC Contribution and the Redemptions.
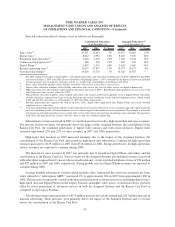
Income tax provision. TWC’s income tax provision has been prepared as if the Company operated as a stand-
alone taxpayer for all periods presented. In 2006 and 2005, the Company recorded income tax provisions of
$620 million and $153 million, respectively. The effective tax rate was approximately 40% in 2006 compared to
approximately 12% in 2005. The increase in the effective tax rate was primarily due to the favorable impact in 2005
of state tax law changes in Ohio, an ownership restructuring in Texas and certain other methodology changes. The
income tax provision for 2005, absent the noted deferred tax impacts, would have been $532 million, with a related
effective tax rate of approximately 41%.
Income from continuing operations. Income from continuing operations was $936 million in 2006 compared
to $1.149 billion in 2005. Basic and diluted income per common share from continuing operations were $0.95 in
2006 compared to $1.15 in 2005. These decreases were primarily due to the increase in the income tax provision,
discussed above, and higher interest expense, partially offset by increased Operating Income and income from
equity investments, net.
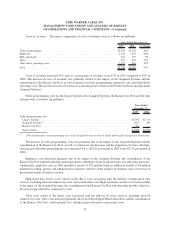
Discontinued operations, net of tax. Discontinued operations, net of tax, reflect the impact of treating the
Transferred Systems as discontinued operations. In 2006 and 2005, the Company recognized pretax income
applicable to these systems of $285 million and $163 million, respectively, ($1.038 billion and $104 million,
respectively, net of a tax benefit). Included in the 2006 results were a pretax gain of $165 million on the Transferred
Systems and a net tax benefit of $800 million comprised of a tax benefit of $814 million on the Redemptions,
partially offset by a provision of $14 million on the Exchange. The tax benefit of $814 million resulted primarily
from the reversal of historical deferred tax liabilities that had existed on systems transferred to Comcast in the TWC
Redemption. The TWC Redemption was designed to qualify as a tax-free split-off under section 355 of the Internal
Revenue Code of 1986, as amended, and as a result, such liabilities were no longer required. However, if the IRS
were successful in challenging the tax-free characterization of the TWC Redemption, an additional cash liability on
account of taxes of up to an estimated $900 million could become payable by the Company.
62
TIME WARNER CABLE INC.
MANAGEMENT’S DISCUSSION AND ANALYSIS OF RESULTS
OF OPERATIONS AND FINANCIAL CONDITION—(Continued)