Time Warner Cable 2007 Annual Report Download - page 129
Download and view the complete annual report
Please find page 129 of the 2007 Time Warner Cable annual report below. You can navigate through the pages in the report by either clicking on the pages listed below, or by using the keyword search tool below to find specific information within the annual report.-
 1
1 -
2
-
3
-
4
-
5
-
6
-
7
-
8
-
9
-
10
-
11
-
12
-
13
-
14
-
15
-
16
-
17
-
18
-
19
-
20
-
21
-
22
-
23
-
24
-
25
-
26
-
27
-
28
-
29
-
30
-
31
-
32
-
33
-
34
-
35
-
36
-
37
-
38
-
39
-
40
-
41
-
42
-
43
-
44
-
45
-
46
-
47
-
48
-
49
-
50
-
51
-
52
-
53
-
54
-
55
-
56
-
57
-
58
-
59
-
60
-
61
-
62
-
63
-
64
-
65
-
66
-
67
-
68
-
69
-
70
-
71
-
72
-
73
-
74
-
75
-
76
-
77
-
78
-
79
-
80
-
81
-
82
-
83
-
84
-
85
-
86
-
87
-
88
-
89
-
90
-
91
-
92
-
93
-
94
-
95
-
96
-
97
-
98
-
99
-
100
-
101
-
102
-
103
-
104
-
105
-
106
-
107
-
108
-
109
-
110
-
111
-
112
-
113
-
114
-
115
-
116
-
117
-
118
-
 119
119 -
 120
120 -
 121
121 -
 122
122 -
 123
123 -
 124
124 -
 125
125 -
 126
126 -
 127
127 -
 128
128 -
 129
129 -
 130
130 -
 131
131 -
 132
132 -
 133
133 -
 134
134 -
 135
135 -
 136
136 -
 137
137 -
 138
138 -
 139
139 -
140
-
141
-
142
-
143
-
144
-
145
-
146
-
147
-
148
-
149
 |
 |

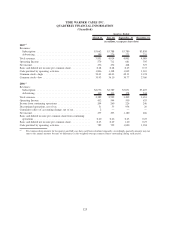
TIME WARNER CABLE INC.
SELECTED FINANCIAL INFORMATION
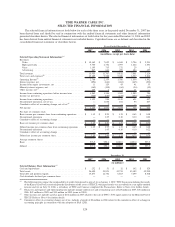
The selected financial information set forth below for each of the three years in the period ended December 31, 2007 has
been derived from and should be read in conjunction with the audited financial statements and other financial information
presented elsewhere herein. The selected financial information set forth below for the years ended December 31, 2004 and 2003
has been derived from audited financial statements not included herein. Capitalized terms are as defined and described in the
consolidated financial statements or elsewhere herein.
2007 2006 2005 2004 2003
Years Ended December 31,
(in millions, except per share data)
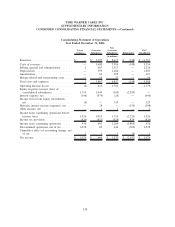
Selected Operating Statement Information:
(a)
Revenues:
Video....................................... $ 10,165 $ 7,632 $ 6,044 $ 5,706 $ 5,351
High-speed data . . .............................. 3,730 2,756 1,997 1,642 1,331
Voice ....................................... 1,193 715 272 29 1
Advertising ................................... 867 664 499 484 437
Total revenues................................... 15,955 11,767 8,812 7,861 7,120
Total costs and expenses
(b)
.......................... 13,189 9,588 7,026 6,307 5,818
Operating Income
(b)
............................... 2,766 2,179 1,786 1,554 1,302
Interest expense, net . .............................. (894) (646) (464) (465) (492)
Income from equity investments, net .................... 11 129 43 41 33
Minority interest expense, net......................... (165) (108) (64) (56) (59)
Other income, net
(c)
............................... 145 2 1 11 —
Income from continuing operations before income taxes . . ..... 1,863 1,556 1,302 1,085 784
Income tax provision .............................. (740) (620) (153) (454) (327)
Income from continuing operations . .................... 1,123 936 1,149 631 457
Discontinued operations, net of tax . .................... — 1,038 104 95 207
Cumulative effect of accounting change, net of tax
(d)
......... — 2 — — —
Net income . ................................... $ 1,123 $ 1,976 $ 1,253 $ 726 $ 664
Per share of common stock:
Basic income per common share from continuing operations .... $ 1.15 $ 0.95 $ 1.15 $ 0.63 $ 0.48
Discontinued operations . . . ......................... — 1.05 0.10 0.10 0.22
Cumulative effect of accounting change . . . ............... — ————
Basic net income per common share .................... $ 1.15 $ 2.00 $ 1.25 $ 0.73 $ 0.70
Diluted income per common share from continuing operations . . . $ 1.15 $ 0.95 $ 1.15 $ 0.63 $ 0.48
Discontinued operations . . . ......................... — 1.05 0.10 0.10 0.22
Cumulative effect of accounting change . . . ............... — ————
Diluted net income per common share ................... $ 1.15 $ 2.00 $ 1.25 $ 0.73 $ 0.70
Average common shares:
Basic ........................................ 976.9 990.4 1,000.0 1,000.0 955.3
Diluted ....................................... 977.2 990.4 1,000.0 1,000.0 955.3
2007 2006 2005 2004 2003
December 31,
(in millions)
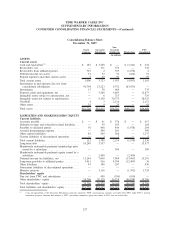
Selected Balance Sheet Information:
(a)
Cash and equivalents .............................. $ 232 $ 51 $ 12 $ 102 $ 329
Total assets . ................................... 56,600 55,821 43,724 43,189 42,950
Total debt and preferred equity ........................ 13,877 14,732 6,863 7,299 8,368
Cash dividends declared per common share. ............... — ————
(a)
The following items impact the comparability of results from period to period: (i) on January 1, 2007, TWC began consolidating the results
of the Kansas City Pool it received upon the distribution of the assets of TKCCP, which previously was accounted for as an equity-method
investee and (ii) on July 31, 2006, a subsidiary of TWC and Comcast completed the Transactions. Refer to Note 4 for further details.
(b)
Total costs and expenses and Operating Income includes merger-related costs and restructuring costs of $23 million in 2007, $56 million in
2006, $42 million in 2005 and $15 million in 2003 (none in 2004).
(c)
Other income, net, includes a pretax gain of $146 million in 2007 related to the sale of TWC’s 50% equity interest in the Houston Pool of
TKCCP. Refer to Note 4 for further details.
(d)
Cumulative effect of accounting change, net of tax, includes a benefit of $2 million in 2006 related to the cumulative effect of a change in
accounting principle in connection with the adoption of FAS 123R.
124