Time Warner Cable 2007 Annual Report Download - page 60
Download and view the complete annual report
Please find page 60 of the 2007 Time Warner Cable annual report below. You can navigate through the pages in the report by either clicking on the pages listed below, or by using the keyword search tool below to find specific information within the annual report.-
 1
1 -
2
-
3
-
4
-
5
-
6
-
7
-
8
-
9
-
10
-
11
-
12
-
13
-
14
-
15
-
16
-
17
-
18
-
19
-
20
-
21
-
22
-
23
-
24
-
25
-
26
-
27
-
28
-
29
-
30
-
31
-
32
-
33
-
34
-
35
-
36
-
37
-
38
-
39
-
40
-
41
-
42
-
43
-
44
-
45
-
46
-
47
-
48
-
49
-
 50
50 -
 51
51 -
 52
52 -
 53
53 -
 54
54 -
 55
55 -
 56
56 -
 57
57 -
 58
58 -
 59
59 -
 60
60 -
 61
61 -
 62
62 -
 63
63 -
 64
64 -
 65
65 -
 66
66 -
 67
67 -
 68
68 -
 69
69 -
 70
70 -
71
-
72
-
73
-
74
-
75
-
76
-
77
-
78
-
79
-
80
-
81
-
82
-
83
-
84
-
85
-
86
-
87
-
88
-
89
-
90
-
91
-
92
-
93
-
94
-
95
-
96
-
97
-
98
-
99
-
100
-
101
-
102
-
103
-
104
-
105
-
106
-
107
-
108
-
109
-
110
-
111
-
112
-
113
-
114
-
115
-
116
-
117
-
118
-
119
-
120
-
121
-
122
-
123
-
124
-
125
-
126
-
127
-
128
-
129
-
130
-
131
-
132
-
133
-
134
-
135
-
136
-
137
-
138
-
139
-
140
-
141
-
142
-
143
-
144
-
145
-
146
-
147
-
148
-
149
 |
 |

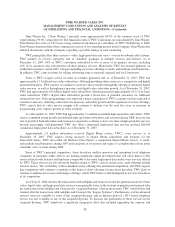
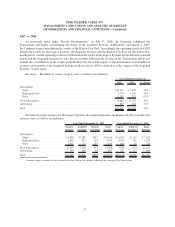
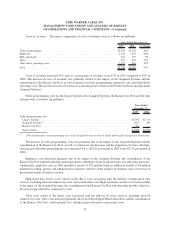
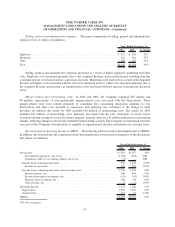
Costs of revenues. The major components of costs of revenues were as follows (in millions):
2007 2006 % Change
Years Ended December 31,
Video programming. . . . . . . . . . . . . . . . . . . . . . . . . . . . . . . . . . . . . . . . . . . . . . . . . . $3,534 $2,523 40%
Employee. . . . . . . . . . . . . . . . . . . . . . . . . . . . . . . . . . . . . . . . . . . . . . . . . . . . . . . . . 2,164 1,505 44%
High-speed data . . . . . . . . . . . . . . . . . . . . . . . . . . . . . . . . . . . . . . . . . . . . . . . . . . . . 164 156 5%
Voice............................................................ 455 309 47%
Other direct operating costs . . . . . . . . . . . . . . . . . . . . . . . . . . . . . . . . . . . . . . . . . . . . 1,225 863 42%
Total . . . . . . . . . . . . . . . . . . . . . . . . . . . . . . . . . . . . . . . . . . . . . . . . . . . . . . . . . . . . $7,542 $5,356 41%
Costs of revenues increased 41%, and, as a percentage of revenues, were 47% in 2007 compared to 46% in
2006. The increase in costs of revenues was primarily related to the impact of the Acquired Systems and the
consolidation of the Kansas City Pool, as well as increases in video programming, employee, voice and other direct
operating costs. The increase in costs of revenues as a percentage of revenues in 2007 reflected lower margins in the
Acquired Systems.
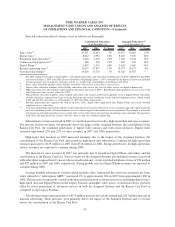
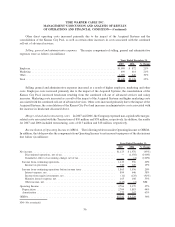
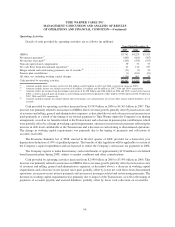
Video programming costs for the Legacy Systems, the Acquired Systems, the Kansas City Pool and the total
systems were as follows (in millions):
2007 2006
Years Ended
December 31,
Video programming costs:
Legacy Systems . . . . . . . . . . . . . . . . . . . . . . . . . . . . . . . . . . . . . . . . . . . . . . . . . . . . . . . . . . . . $2,305 $2,114
Acquired Systems
(a)
......................................................... 1,027 409
KansasCityPool ........................................................... 202 —
Total systems . . . . . . . . . . . . . . . . . . . . . . . . . . . . . . . . . . . . . . . . . . . . . . . . . . . . . . . . . . . . . . $3,534 $2,523
(a)
2006 amounts reflect video programming costs for the Acquired Systems for the five months following the closing of the Transactions.
The increase in video programming costs was primarily due to the impact of the Acquired Systems and the
consolidation of the Kansas City Pool, as well as contractual rate increases and the expansion of service offerings.
Average per-subscriber programming costs increased 8% to $22.04 per month in 2007 from $20.33 per month in
2006.
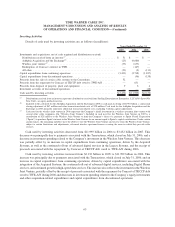
Employee costs increased primarily due to the impact of the Acquired Systems, the consolidation of the
Kansas City Pool, higher headcount resulting from the continued roll-out of advanced services and salary increases.
Additionally, employee costs in 2006 included a benefit of $32 million (with an additional benefit of $8 million
included in selling, general and administrative expenses) related to both changes in estimates and a correction of
prior period medical benefit accruals.
High-speed data service costs consist of the direct costs associated with the delivery of high-speed data
services, including network connectivity costs, and certain other costs. High-speed data service costs increased due
to the impact of the Acquired Systems, the consolidation of the Kansas City Pool and subscriber growth, offset by a
decrease in per-subscriber connectivity costs.
Voice costs consist of the direct costs associated with the delivery of voice services, including network
connectivity costs. Voice costs increased primarily due to growth in Digital Phone subscribers and the consolidation
of the Kansas City Pool, offset partially by a decline in per-subscriber connectivity costs.
55
TIME WARNER CABLE INC.
MANAGEMENT’S DISCUSSION AND ANALYSIS OF RESULTS
OF OPERATIONS AND FINANCIAL CONDITION—(Continued)