Time Warner Cable 2007 Annual Report Download - page 130
Download and view the complete annual report
Please find page 130 of the 2007 Time Warner Cable annual report below. You can navigate through the pages in the report by either clicking on the pages listed below, or by using the keyword search tool below to find specific information within the annual report.-
 1
1 -
2
-
3
-
4
-
5
-
6
-
7
-
8
-
9
-
10
-
11
-
12
-
13
-
14
-
15
-
16
-
17
-
18
-
19
-
20
-
21
-
22
-
23
-
24
-
25
-
26
-
27
-
28
-
29
-
30
-
31
-
32
-
33
-
34
-
35
-
36
-
37
-
38
-
39
-
40
-
41
-
42
-
43
-
44
-
45
-
46
-
47
-
48
-
49
-
50
-
51
-
52
-
53
-
54
-
55
-
56
-
57
-
58
-
59
-
60
-
61
-
62
-
63
-
64
-
65
-
66
-
67
-
68
-
69
-
70
-
71
-
72
-
73
-
74
-
75
-
76
-
77
-
78
-
79
-
80
-
81
-
82
-
83
-
84
-
85
-
86
-
87
-
88
-
89
-
90
-
91
-
92
-
93
-
94
-
95
-
96
-
97
-
98
-
99
-
100
-
101
-
102
-
103
-
104
-
105
-
106
-
107
-
108
-
109
-
110
-
111
-
112
-
113
-
114
-
115
-
116
-
117
-
118
-
119
-
 120
120 -
 121
121 -
 122
122 -
 123
123 -
 124
124 -
 125
125 -
 126
126 -
 127
127 -
 128
128 -
 129
129 -
 130
130 -
 131
131 -
 132
132 -
 133
133 -
 134
134 -
 135
135 -
 136
136 -
 137
137 -
 138
138 -
 139
139 -
 140
140 -
141
-
142
-
143
-
144
-
145
-
146
-
147
-
148
-
149
 |
 |

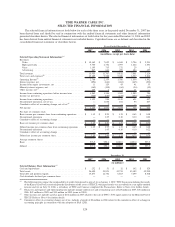
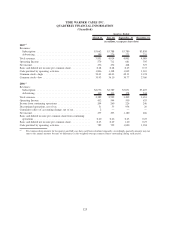
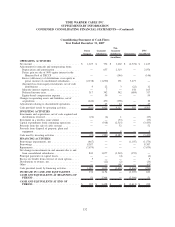
TIME WARNER CABLE INC.
QUARTERLY FINANCIAL INFORMATION
(Unaudited)
March 31, June 30, September, 30 December 31,
Quarters Ended
(in millions, except per share data)
2007
(a)
Revenues:
Subscription . . . . . . . . . . . . . . . . . . . . . . . . . . . . . . . . . . . . $3,662 $3,788 $3,780 $3,858
Advertising . . . . . . . . . . . . . . . . . . . . . . . . . . . . . . . . . . . . . 189 226 221 231
Total revenues . . . . . . . . . . . . . . . . . . . . . . . . . . . . . . . . . . . . . 3,851 4,014 4,001 4,089
Operating Income . . . . . . . . . . . . . . . . . . . . . . . . . . . . . . . . . . 579 711 681 795
Net income . . . . . . . . . . . . . . . . . . . . . . . . . . . . . . . . . . . . . . . 276 272 248 327
Basic and diluted net income per common share . . . . . . . . . . . . . 0.28 0.28 0.25 0.33
Cash provided by operating activities . . . . . . . . . . . . . . . . . . . . . 1,006 1,198 1,049 1,310
Common stock—high . . . . . . . . . . . . . . . . . . . . . . . . . . . . . . . 39.01 40.03 42.11 33.74
Common stock—low . . . . . . . . . . . . . . . . . . . . . . . . . . . . . . . . 35.93 36.10 30.77 23.60
2006
(a)
Revenues:
Subscription . . . . . . . . . . . . . . . . . . . . . . . . . . . . . . . . . . . . $2,276 $2,389 $3,031 $3,407
Advertising . . . . . . . . . . . . . . . . . . . . . . . . . . . . . . . . . . . . . 109 133 178 244
Total revenues . . . . . . . . . . . . . . . . . . . . . . . . . . . . . . . . . . . . . 2,385 2,522 3,209 3,651
Operating Income . . . . . . . . . . . . . . . . . . . . . . . . . . . . . . . . . . 452 544 550 633
Income from continuing operations . . . . . . . . . . . . . . . . . . . . . . 204 260 226 246
Discontinued operations, net of tax . . . . . . . . . . . . . . . . . . . . . . 31 33 954 20
Cumulative effect of accounting change, net of tax . . . . . . . . . . . 2 — — —
Net income . . . . . . . . . . . . . . . . . . . . . . . . . . . . . . . . . . . . . . . 237 293 1,180 266
Basic and diluted income per common share from continuing
operations . . . . . . . . . . . . . . . . . . . . . . . . . . . . . . . . . . . . . . 0.20 0.26 0.23 0.25
Basic and diluted net income per common share . . . . . . . . . . . . . 0.23 0.29 1.20 0.27
Cash provided by operating activities . . . . . . . . . . . . . . . . . . . . . 782 759 1,020 1,034
(a)
Per common share amounts for the quarters and full years have each been calculated separately. Accordingly, quarterly amounts may not
sum to the annual amounts because of differences in the weighted-average common shares outstanding during each period.
125