Time Magazine 2014 Annual Report Download - page 54
Download and view the complete annual report
Please find page 54 of the 2014 Time Magazine annual report below. You can navigate through the pages in the report by either clicking on the pages listed below, or by using the keyword search tool below to find specific information within the annual report.-
 1
1 -
2
-
3
-
4
-
5
-
6
-
7
-
8
-
9
-
10
-
11
-
12
-
13
-
14
-
15
-
16
-
17
-
18
-
19
-
20
-
21
-
22
-
23
-
24
-
25
-
26
-
27
-
28
-
29
-
30
-
31
-
32
-
33
-
34
-
35
-
36
-
37
-
38
-
39
-
40
-
41
-
42
-
43
-
 44
44 -
 45
45 -
 46
46 -
 47
47 -
 48
48 -
 49
49 -
 50
50 -
 51
51 -
 52
52 -
 53
53 -
 54
54 -
 55
55 -
 56
56 -
 57
57 -
 58
58 -
 59
59 -
 60
60 -
 61
61 -
 62
62 -
 63
63 -
 64
64 -
65
-
66
-
67
-
68
-
69
-
70
-
71
-
72
-
73
-
74
-
75
-
76
-
77
-
78
-
79
-
80
-
81
-
82
-
83
-
84
-
85
-
86
-
87
-
88
-
89
-
90
-
91
-
92
-
93
-
94
-
95
-
96
-
97
-
98
-
99
-
100
-
101
-
102
-
103
-
104
-
105
-
106
-
107
-
108
-
109
-
110
-
111
-
112
-
113
-
114
-
115
-
116
-
117
-
118
-
119
-
120
-
121
-
122
-
123
-
124
-
125
-
126
-
127
-
128
-
129
-
130
-
131
-
132
-
133
-
134
-
135
-
136
-
137
-
138
 |
 |
TIME WARNER INC.
MANAGEMENT’S DISCUSSION AND ANALYSIS
OF RESULTS OF OPERATIONS AND FINANCIAL CONDITION – (Continued)
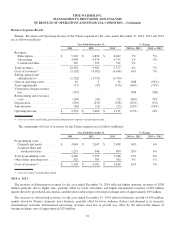
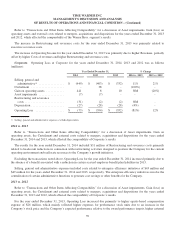
Refer to “Transactions and Other Items Affecting Comparability” for a discussion of Asset impairments, Gain (loss) on
operating assets, Venezuelan foreign currency loss and external costs related to mergers, acquisitions and dispositions for the
years ended December 31, 2014 and 2013, which affected the comparability of the Warner Bros. segment’s results.
The results for the year ended December 31, 2014 included $169 million of Restructuring and severance costs primarily
related to headcount reductions in connection with restructuring activities designed to position the Company for the current
operating environment and reallocate resources to the Company’s growth initiatives. The results for the year ended
December 31, 2013 included $49 million of Restructuring and severance costs primarily related to executive severance costs.
The decrease in Operating Income for the year ended December 31, 2014 was primarily due to higher Costs of revenues
and higher Restructuring and severance costs, partially offset by higher Revenues.
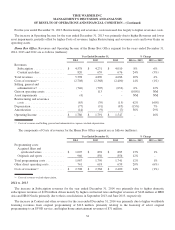
2013 vs. 2012
The increase in Revenues for the year ended December 31, 2013 included the net unfavorable impact of foreign exchange
rates of approximately $110 million.
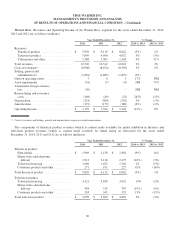
Theatrical product revenues from film rentals increased for the year ended December 31, 2013, reflecting higher revenues
of $315 million from theatrical films released during 2013, partially offset by lower carryover revenues of $51 million from
prior period releases. The Company released 18 and 17 theatrical films during 2013 and 2012, respectively.
For the year ended December 31, 2013, theatrical product revenues from home video and electronic delivery decreased
due to lower revenues of $120 million from prior period releases, which include catalog titles, partially offset by higher
revenues of $63 million from releases in 2013. There were 17 and 21 home video and electronic delivery releases in 2013
and 2012, respectively.
Theatrical product revenues from television licensing decreased for the year ended December 31, 2013 primarily due to
fewer availabilities in 2013 as compared to 2012.
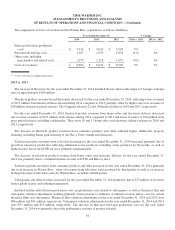
Television product revenues from television licensing for the year ended December 31, 2013 decreased due to the timing
of worldwide television availabilities, partially offset by higher revenues from availabilities of television product to SVOD
services.
The decrease in television product revenues from home video and electronic delivery for the year ended December 31,
2013 was primarily due to lower revenues from consumer packaged goods.
Videogames and other revenues increased for the year ended December 31, 2013 primarily due to higher revenues of
$297 million from videogames released in 2013, partially offset by lower carryover revenues of $76 million from
videogames released in prior periods. The Company released 10 videogames in both 2013 and 2012. In addition, the increase
in Videogames and other revenues for the year ended December 31, 2013 reflected higher publishing and consumer products
revenues.
Included in film and television production costs are production costs related to videogames, as well as theatrical film
valuation adjustments resulting from revisions to estimates of ultimate revenue for certain theatrical films. Theatrical film
valuation adjustments for the years ended December 31, 2013 and 2012 were $51 million and $92 million, respectively. Film
and television production costs were essentially flat as higher costs for videogames, including impairments for certain
videogame production costs, which were $53 million in 2013 and $7 million in 2012, were offset by lower theatrical film
valuation adjustments and lower amortization costs for theatrical films. The increase in print and advertising costs was
primarily due to the mix and quantity of theatrical films and videogames released. Other costs, including merchandise and
related costs, increased primarily due to higher distribution costs associated with videogames and home video sales.
38