Time Magazine 2014 Annual Report Download - page 48
Download and view the complete annual report
Please find page 48 of the 2014 Time Magazine annual report below. You can navigate through the pages in the report by either clicking on the pages listed below, or by using the keyword search tool below to find specific information within the annual report.-
 1
1 -
2
-
3
-
4
-
5
-
6
-
7
-
8
-
9
-
10
-
11
-
12
-
13
-
14
-
15
-
16
-
17
-
18
-
19
-
20
-
21
-
22
-
23
-
24
-
25
-
26
-
27
-
28
-
29
-
30
-
31
-
32
-
33
-
34
-
35
-
36
-
37
-
 38
38 -
 39
39 -
 40
40 -
 41
41 -
 42
42 -
 43
43 -
 44
44 -
 45
45 -
 46
46 -
 47
47 -
 48
48 -
 49
49 -
 50
50 -
 51
51 -
 52
52 -
 53
53 -
 54
54 -
 55
55 -
 56
56 -
 57
57 -
 58
58 -
59
-
60
-
61
-
62
-
63
-
64
-
65
-
66
-
67
-
68
-
69
-
70
-
71
-
72
-
73
-
74
-
75
-
76
-
77
-
78
-
79
-
80
-
81
-
82
-
83
-
84
-
85
-
86
-
87
-
88
-
89
-
90
-
91
-
92
-
93
-
94
-
95
-
96
-
97
-
98
-
99
-
100
-
101
-
102
-
103
-
104
-
105
-
106
-
107
-
108
-
109
-
110
-
111
-
112
-
113
-
114
-
115
-
116
-
117
-
118
-
119
-
120
-
121
-
122
-
123
-
124
-
125
-
126
-
127
-
128
-
129
-
130
-
131
-
132
-
133
-
134
-
135
-
136
-
137
-
138
 |
 |

TIME WARNER INC.
MANAGEMENT’S DISCUSSION AND ANALYSIS
OF RESULTS OF OPERATIONS AND FINANCIAL CONDITION – (Continued)
Business Segment Results
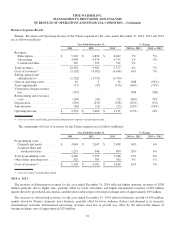
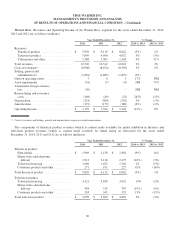
Turner. Revenues and Operating Income of the Turner segment for the years ended December 31, 2014, 2013 and 2012
are as follows (millions):
Year Ended December 31, % Change
2014 2013 2012 2014 vs. 2013 2013 vs. 2012
Revenues:
Subscription ................ $ 5,263 $ 4,896 $ 4,660 7% 5%
Advertising ................ 4,568 4,534 4,315 1% 5%
Content and other ............ 565 553 552 2% -
Total revenues ................ 10,396 9,983 9,527 4% 5%
Costs of revenues(a) ............ (5,102) (4,382) (4,168) 16% 5%
Selling, general and
administrative(a) ............. (1,728) (1,725) (1,730) - -
Gain on operating assets ........ 16 2 34 NM (94%)
Asset impairments ............. (17) (47) (176) (64%) (73%)
Venezuelan foreign currency
loss ....................... (137) - - NM NM
Restructuring and severance
costs ...................... (249) (93) (52) 168% 79%
Depreciation .................. (209) (231) (238) (10%) (3%)
Amortization ................. (16) (21) (25) (24%) (16%)
Operating Income ............. $ 2,954 $ 3,486 $ 3,172 (15%) 10%
(a) Costs of revenues and Selling, general and administrative expenses exclude depreciation.
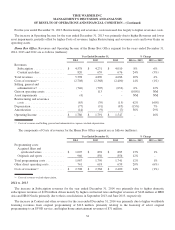
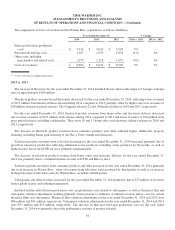
The components of Costs of revenues for the Turner segment are as follows (millions):
Year Ended December 31, % Change
2014 2013 2012 2014 vs. 2013 2013 vs. 2012
Programming costs:
Originals and sports .......... $ 3,069 $ 2,647 $ 2,498 16% 6%
Acquired films and
syndicated series .......... 1,213 946 890 28% 6%
Total programming costs ........ 4,282 3,593 3,388 19% 6%
Other direct operating costs ...... 820 789 780 4% 1%
Costs of revenues(a) ............ $ 5,102 $ 4,382 $ 4,168 16% 5%
(a) Costs of revenues exclude depreciation.
2014 vs. 2013
The increase in Subscription revenues for the year ended December 31, 2014 reflected higher domestic revenues of $298
million primarily due to higher rates, partially offset by lower subscribers and higher international revenues of $69 million
mainly driven by growth in Latin America and the unfavorable impact of foreign exchange rates of approximately $50 million.
The increase in Advertising revenues for the year ended December 31, 2014 reflected domestic growth of $34 million,
mainly driven by Turner’s domestic news business, partially offset by lower audience delivery and demand at its domestic
entertainment networks. International advertising revenues were flat as growth was offset by the unfavorable impact of
foreign exchange rates of approximately $25 million.
32