Time Magazine 2014 Annual Report Download - page 14
Download and view the complete annual report
Please find page 14 of the 2014 Time Magazine annual report below. You can navigate through the pages in the report by either clicking on the pages listed below, or by using the keyword search tool below to find specific information within the annual report.-
 1
1 -
2
-
3
-
 4
4 -
 5
5 -
 6
6 -
 7
7 -
 8
8 -
 9
9 -
 10
10 -
 11
11 -
 12
12 -
 13
13 -
 14
14 -
 15
15 -
 16
16 -
 17
17 -
 18
18 -
 19
19 -
 20
20 -
 21
21 -
 22
22 -
 23
23 -
 24
24 -
25
-
26
-
27
-
28
-
29
-
30
-
31
-
32
-
33
-
34
-
35
-
36
-
37
-
38
-
39
-
40
-
41
-
42
-
43
-
44
-
45
-
46
-
47
-
48
-
49
-
50
-
51
-
52
-
53
-
54
-
55
-
56
-
57
-
58
-
59
-
60
-
61
-
62
-
63
-
64
-
65
-
66
-
67
-
68
-
69
-
70
-
71
-
72
-
73
-
74
-
75
-
76
-
77
-
78
-
79
-
80
-
81
-
82
-
83
-
84
-
85
-
86
-
87
-
88
-
89
-
90
-
91
-
92
-
93
-
94
-
95
-
96
-
97
-
98
-
99
-
100
-
101
-
102
-
103
-
104
-
105
-
106
-
107
-
108
-
109
-
110
-
111
-
112
-
113
-
114
-
115
-
116
-
117
-
118
-
119
-
120
-
121
-
122
-
123
-
124
-
125
-
126
-
127
-
128
-
129
-
130
-
131
-
132
-
133
-
134
-
135
-
136
-
137
-
138
 |
 |

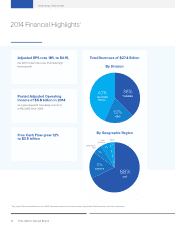
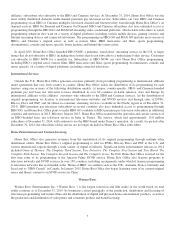
2014 Financial Highlights1
Adjusted EPS rose 18% to $4.15,
the sixth consecutive year of at least high
teens growth
Posted Adjusted Operating
Income of $5.8 billion in 2014
and grew Adjusted Operating Income at
a 6% CAGR since 2009
Free Cash Flow grew 12%
to $3.5 billion
38%
43%
.
19%
Asia Pacific
Rim
Latin
America
Other
68%
..
17%
6%
6%
3%
Total Revenues of $27.4 Billion
By Division
By Geographic Region
1 See page 116 for reconciliations of non-GAAP financial measures to the most directly comparable GAAP measures and other information.
Time Warner Annual Report12