Time Magazine 2014 Annual Report Download - page 45
Download and view the complete annual report
Please find page 45 of the 2014 Time Magazine annual report below. You can navigate through the pages in the report by either clicking on the pages listed below, or by using the keyword search tool below to find specific information within the annual report.-
 1
1 -
2
-
3
-
4
-
5
-
6
-
7
-
8
-
9
-
10
-
11
-
12
-
13
-
14
-
15
-
16
-
17
-
18
-
19
-
20
-
21
-
22
-
23
-
24
-
25
-
26
-
27
-
28
-
29
-
30
-
31
-
32
-
33
-
34
-
 35
35 -
 36
36 -
 37
37 -
 38
38 -
 39
39 -
 40
40 -
 41
41 -
 42
42 -
 43
43 -
 44
44 -
 45
45 -
 46
46 -
 47
47 -
 48
48 -
 49
49 -
 50
50 -
 51
51 -
 52
52 -
 53
53 -
 54
54 -
 55
55 -
56
-
57
-
58
-
59
-
60
-
61
-
62
-
63
-
64
-
65
-
66
-
67
-
68
-
69
-
70
-
71
-
72
-
73
-
74
-
75
-
76
-
77
-
78
-
79
-
80
-
81
-
82
-
83
-
84
-
85
-
86
-
87
-
88
-
89
-
90
-
91
-
92
-
93
-
94
-
95
-
96
-
97
-
98
-
99
-
100
-
101
-
102
-
103
-
104
-
105
-
106
-
107
-
108
-
109
-
110
-
111
-
112
-
113
-
114
-
115
-
116
-
117
-
118
-
119
-
120
-
121
-
122
-
123
-
124
-
125
-
126
-
127
-
128
-
129
-
130
-
131
-
132
-
133
-
134
-
135
-
136
-
137
-
138
 |
 |

TIME WARNER INC.
MANAGEMENT’S DISCUSSION AND ANALYSIS
OF RESULTS OF OPERATIONS AND FINANCIAL CONDITION – (Continued)
Consolidated Results
The following discussion provides an analysis of the Company’s results of operations and should be read in conjunction
with the accompanying Consolidated Statement of Operations.
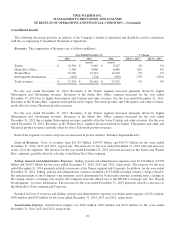
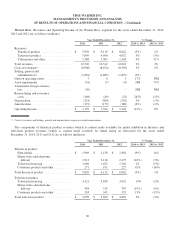
Revenues. The components of Revenues are as follows (millions):
Year Ended December 31, % Change
2014 2013 2012 2014 vs. 2013 2013 vs. 2012
(recast) (recast)
Turner .................... $ 10,396 $ 9,983 $ 9,527 4% 5%
Home Box Office ............ 5,398 4,890 4,686 10% 4%
Warner Bros. ............... 12,526 12,312 12,018 2% 2%
Intersegment eliminations ..... (961) (724) (906) 33% (20%)
Total revenues .............. $ 27,359 $ 26,461 $ 25,325 3% 4%
For the year ended December 31, 2014, Revenues at the Turner segment increased primarily driven by higher
Subscription and Advertising revenues. Revenues at the Home Box Office segment increased for the year ended
December 31, 2014 due to higher Subscription and Content and other revenues. For the year ended December 31, 2014,
Revenues at the Warner Bros. segment increased driven by higher Television product and Videogames and other revenues,
partly offset by lower Theatrical product revenues.
For the year ended December 31, 2013, Revenues at the Turner segment increased primarily driven by higher
Subscription and Advertising revenues. Revenues at the Home Box Office segment increased for the year ended
December 31, 2013 due to higher Subscription revenues, partially offset by lower Content and other revenues. For the year
ended December 31, 2013, Revenues at the Warner Bros. segment increased driven by higher Videogames and other and
Theatrical product revenues, partially offset by lower Television product revenues.
Each of the segment’s revenue categories are discussed in greater detail in “Business Segment Results.”
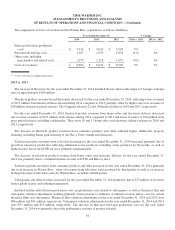
Costs of Revenues. Costs of revenues were $15.875 billion, $14.935 billion and $14.575 billion for the years ended
December 31, 2014, 2013 and 2012, respectively. The increase for the year ended December 31, 2014 reflected increases
across all of the segments. The increase for the year ended December 31, 2013 reflected increases at the Turner and Warner
Bros. segments, partially offset by a decline at the Home Box Office segment.
Selling, General and Administrative Expenses. Selling, general and administrative expenses were $5.190 billion, $4.934
billion and $4.813 billion for the years ended December 31, 2014, 2013 and 2012, respectively. The increase for the year
ended December 31, 2014 primarily related to increases at the Turner segment and Corporate. In addition, for the year ended
December 31, 2014, Selling, general and administrative expenses included a $173 million foreign currency charge related to
the remeasurement of the Company’s net monetary assets denominated in Venezuelan currency resulting from a change in
the foreign currency exchange rate used by the Company from the official rate to the SICAD 2 exchange rate. See “Recent
Developments” for more information. The increase for the year ended December 31, 2013 primarily related to increases at
the Home Box Office segment and Corporate.
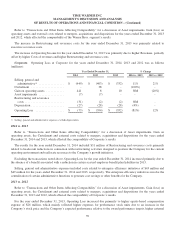
Included in Costs of revenues and Selling, general and administrative expenses was depreciation expense of $531 million,
$550 million and $553 million for the years ended December 31, 2014, 2013 and 2012, respectively.
Amortization Expense. Amortization expense was $202 million, $209 million and $212 million for the years ended
December 31, 2014, 2013 and 2012, respectively.
29