Time Magazine 2014 Annual Report Download - page 131
Download and view the complete annual report
Please find page 131 of the 2014 Time Magazine annual report below. You can navigate through the pages in the report by either clicking on the pages listed below, or by using the keyword search tool below to find specific information within the annual report.-
 1
1 -
2
-
3
-
4
-
5
-
6
-
7
-
8
-
9
-
10
-
11
-
12
-
13
-
14
-
15
-
16
-
17
-
18
-
19
-
20
-
21
-
22
-
23
-
24
-
25
-
26
-
27
-
28
-
29
-
30
-
31
-
32
-
33
-
34
-
35
-
36
-
37
-
38
-
39
-
40
-
41
-
42
-
43
-
44
-
45
-
46
-
47
-
48
-
49
-
50
-
51
-
52
-
53
-
54
-
55
-
56
-
57
-
58
-
59
-
60
-
61
-
62
-
63
-
64
-
65
-
66
-
67
-
68
-
69
-
70
-
71
-
72
-
73
-
74
-
75
-
76
-
77
-
78
-
79
-
80
-
81
-
82
-
83
-
84
-
85
-
86
-
87
-
88
-
89
-
90
-
91
-
92
-
93
-
94
-
95
-
96
-
97
-
98
-
99
-
100
-
101
-
102
-
103
-
104
-
105
-
106
-
107
-
108
-
109
-
110
-
111
-
112
-
113
-
114
-
115
-
116
-
117
-
118
-
119
-
120
-
 121
121 -
 122
122 -
 123
123 -
 124
124 -
 125
125 -
 126
126 -
 127
127 -
 128
128 -
 129
129 -
 130
130 -
 131
131 -
 132
132 -
 133
133 -
 134
134 -
 135
135 -
 136
136 -
 137
137 -
 138
138
 |
 |
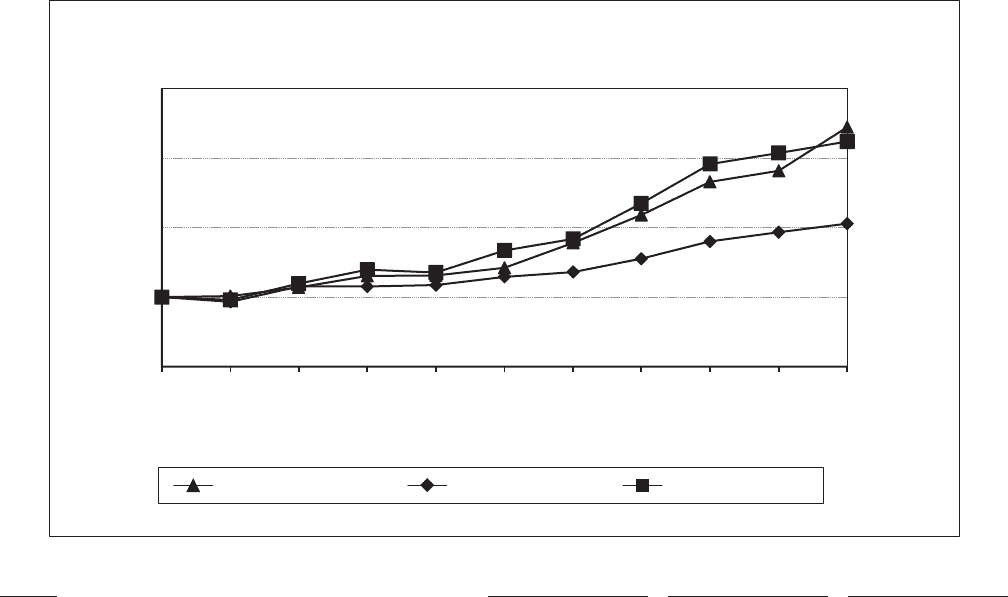
The chart assumes $100 was invested on December 31, 2009 in each of the Company’s Common Stock, the S&P 500
Index and the peer group index and reflects the reinvestment of dividends and distributions on a monthly basis and quarterly
market capitalization weighting. The Company’s historical Common Stock performance has been adjusted to reflect the
separation of Time Inc. from the Company in 2014. From 2010 through 2014, the Company paid a quarterly dividend of
(i) $0.2125 per share in 2010, (ii) $0.2350 in 2011, (iii) $0.2600 per share in 2012, (iv) $0.2875 per share in 2013 and
(v) $0.3175 per share in 2014.
Comparison of Cumulative Total Returns
Dec 09
$0
$100
$200
$300
$400
Time Warner Inc. S&P 500 Index Peer Group Index
Jun 10
Dec 10
Jun 11
Dec 11
Jun 12
Dec 12
Jun 13
Dec 13
Jun 14
Dec 14
Value at
Company
Common Stock S&P 500 Index
Peer Group
Index
December 31, 2009 ............................... $100 $100 $100
June 30, 2010 ................................... 101 93 96
December 31, 2010 ............................... 114 115 119
June 30, 2011 ................................... 130 122 139
December 31, 2011 ............................... 131 117 135
June 30, 2012 ................................... 142 129 167
December 31, 2012 ............................... 178 136 183
June 30, 2013 ................................... 218 155 234
December 31, 2013 ............................... 265 180 291
June 30, 2014 ................................... 281 193 307
December 31, 2014 ............................... 344 205 323
115