Time Magazine 2014 Annual Report Download - page 129
Download and view the complete annual report
Please find page 129 of the 2014 Time Magazine annual report below. You can navigate through the pages in the report by either clicking on the pages listed below, or by using the keyword search tool below to find specific information within the annual report.-
 1
1 -
2
-
3
-
4
-
5
-
6
-
7
-
8
-
9
-
10
-
11
-
12
-
13
-
14
-
15
-
16
-
17
-
18
-
19
-
20
-
21
-
22
-
23
-
24
-
25
-
26
-
27
-
28
-
29
-
30
-
31
-
32
-
33
-
34
-
35
-
36
-
37
-
38
-
39
-
40
-
41
-
42
-
43
-
44
-
45
-
46
-
47
-
48
-
49
-
50
-
51
-
52
-
53
-
54
-
55
-
56
-
57
-
58
-
59
-
60
-
61
-
62
-
63
-
64
-
65
-
66
-
67
-
68
-
69
-
70
-
71
-
72
-
73
-
74
-
75
-
76
-
77
-
78
-
79
-
80
-
81
-
82
-
83
-
84
-
85
-
86
-
87
-
88
-
89
-
90
-
91
-
92
-
93
-
94
-
95
-
96
-
97
-
98
-
99
-
100
-
101
-
102
-
103
-
104
-
105
-
106
-
107
-
108
-
109
-
110
-
111
-
112
-
113
-
114
-
115
-
116
-
117
-
118
-
 119
119 -
 120
120 -
 121
121 -
 122
122 -
 123
123 -
 124
124 -
 125
125 -
 126
126 -
 127
127 -
 128
128 -
 129
129 -
 130
130 -
 131
131 -
 132
132 -
 133
133 -
 134
134 -
 135
135 -
 136
136 -
 137
137 -
 138
138
 |
 |

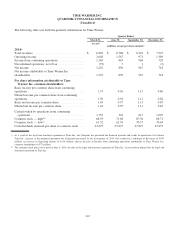
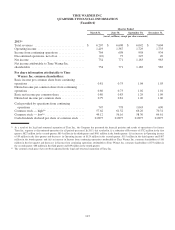
TIME WARNER INC.
QUARTERLY FINANCIAL INFORMATION
(Unaudited)
Quarter Ended
March 31, June 30, September 30, December 31,
(recast, millions, except per share amounts)
2013(a)
Total revenues ................................. $ 6,207 $ 6,608 $ 6,042 $ 7,604
Operating income ............................... 1,419 1,387 1,729 1,733
Income from continuing operations ................. 764 698 958 934
Discontinued operations, net of tax ................. (10) 73 225 49
Net income .................................... 754 771 1,183 983
Net income attributable to Time Warner Inc.
shareholders ................................... 754 771 1,183 983
Per share information attributable to Time
Warner Inc. common shareholders:
Basic income per common share from continuing
operations ..................................... 0.81 0.75 1.04 1.03
Diluted income per common share from continuing
operations ..................................... 0.80 0.73 1.02 1.01
Basic net income per common share ................ 0.80 0.83 1.29 1.09
Diluted net income per common share ............... 0.79 0.81 1.26 1.06
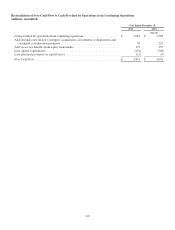
Cash provided by operations from continuing
operations ................................... 747 778 1,043 690
Common stock — high(b) ......................... 57.62 61.52 66.20 70.31
Common stock — low(b) .......................... 49.12 56.16 58.30 64.61
Cash dividends declared per share of common stock . . . 0.2875 0.2875 0.2875 0.2875
(a) As a result of the legal and structural separation of Time Inc., the Company has presented the financial position and results of operations of its former
Time Inc. segment as discontinued operations for all periods presented. In 2013, this resulted in (i) a reduction of Revenues of $732 million in the first
quarter, $827 million in the second quarter, $814 million in the third quarter and $961 million in the fourth quarter; (ii) an increase in Operating income
of $9 million in the first quarter and decreases in Operating income of $124 million in the second quarter, $115 million in the third quarter and $107
million in the fourth quarter; and (iii) an increase in Income from continuing operations attributable to Time Warner Inc. common shareholders of $10
million in the first quarter and decreases in Income from continuing operations attributable to Time Warner Inc. common shareholders of $73 million in
the second quarter, $88 million in the third quarter and $49 million in the fourth quarter.
(b) The common stock prices have not been adjusted for the legal and structural separation of Time Inc.
113