Time Magazine 2014 Annual Report Download - page 111
Download and view the complete annual report
Please find page 111 of the 2014 Time Magazine annual report below. You can navigate through the pages in the report by either clicking on the pages listed below, or by using the keyword search tool below to find specific information within the annual report.-
 1
1 -
2
-
3
-
4
-
5
-
6
-
7
-
8
-
9
-
10
-
11
-
12
-
13
-
14
-
15
-
16
-
17
-
18
-
19
-
20
-
21
-
22
-
23
-
24
-
25
-
26
-
27
-
28
-
29
-
30
-
31
-
32
-
33
-
34
-
35
-
36
-
37
-
38
-
39
-
40
-
41
-
42
-
43
-
44
-
45
-
46
-
47
-
48
-
49
-
50
-
51
-
52
-
53
-
54
-
55
-
56
-
57
-
58
-
59
-
60
-
61
-
62
-
63
-
64
-
65
-
66
-
67
-
68
-
69
-
70
-
71
-
72
-
73
-
74
-
75
-
76
-
77
-
78
-
79
-
80
-
81
-
82
-
83
-
84
-
85
-
86
-
87
-
88
-
89
-
90
-
91
-
92
-
93
-
94
-
95
-
96
-
97
-
98
-
99
-
100
-
 101
101 -
 102
102 -
 103
103 -
 104
104 -
 105
105 -
 106
106 -
 107
107 -
 108
108 -
 109
109 -
 110
110 -
 111
111 -
 112
112 -
 113
113 -
 114
114 -
 115
115 -
 116
116 -
 117
117 -
 118
118 -
 119
119 -
 120
120 -
 121
121 -
122
-
123
-
124
-
125
-
126
-
127
-
128
-
129
-
130
-
131
-
132
-
133
-
134
-
135
-
136
-
137
-
138
 |
 |

TIME WARNER INC.
NOTES TO CONSOLIDATED FINANCIAL STATEMENTS – (Continued)
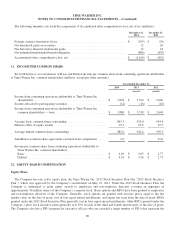
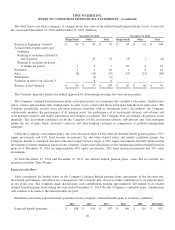
Fair Value of Plan Assets
The following table sets forth by level, within the fair value hierarchy described in Note 5, the assets held by the
Company’s defined benefit pension plans, including those assets related to The CW sub-plan, which were approximately $20
million and $18 million, respectively, as of December 31, 2014 and December 31, 2013 (millions):
December 31, 2014 December 31, 2013
Asset Category Level 1 Level 2 Level 3 Total Level 1 Level 2 Level 3 Total
(recast)
Cash and cash equivalents(a) .... $ 133 $ - $ - $ 133 $ 155 $ - $ - $ 155
Insurance contracts ........... - 14 - 14 - 7 - 7
Equity securities:
Domestic equities .......... 157 - - 157 204 - - 204
International equities ....... 8 - - 8 56 - - 56
Fixed income securities:
U.S. government and
agency securities(a) ....... 259 70 - 329 239 19 - 258
Non-U.S. government and
agency securities ........ 112 - - 112 61 - - 61
Municipal bonds ........... - 23 - 23 - 23 - 23
Investment grade
corporate bonds(b) ........ - 1,187 - 1,187 - 1,048 - 1,048
Non-investment grade
corporate bonds(b) ........ - 20 - 20 - 23 - 23
Other investments:
Pooled investments(c) ....... - 400 - 400 - 457 - 457
Commingled trust funds(a) . . . - 486 - 486 - 391 - 391
Hedge funds .............. - - 30 30 - - 36 36
Other(d) .................. 30 2 77 109 15 10 40 65
Total(e) .................... $ 699 $ 2,202 $ 107 $ 3,008 $ 730 $ 1,978 $ 76 $ 2,784
(a) As of December 31, 2014, cash and cash equivalents include $10 million of cash collateral for securities on loan and U.S. government and agency
securities include $70 million of securities collateral for securities on loan. As of December 31, 2013, commingled trust funds included $11 million of
cash collateral for securities on loan, and U.S. government and agency securities included $5 million of securities collateral for securities on loan.
(b) Investment grade corporate bonds have an S&P rating of BBB- or higher and non-investment grade corporate bonds have an S&P rating of BB+ or
below.
(c) Pooled investments primarily consist of interests in unitized investment pools of which underlying securities primarily consist of equity and fixed
income securities.
(d) Other investments primarily include limited partnerships, 103-12 investments, derivative contracts, exchange-traded funds and mutual funds.
(e) At December 31, 2014 and December 31, 2013, total assets include $78 million and $15 million, respectively, of securities on loan.
95