Time Magazine 2014 Annual Report Download - page 115
Download and view the complete annual report
Please find page 115 of the 2014 Time Magazine annual report below. You can navigate through the pages in the report by either clicking on the pages listed below, or by using the keyword search tool below to find specific information within the annual report.-
 1
1 -
2
-
3
-
4
-
5
-
6
-
7
-
8
-
9
-
10
-
11
-
12
-
13
-
14
-
15
-
16
-
17
-
18
-
19
-
20
-
21
-
22
-
23
-
24
-
25
-
26
-
27
-
28
-
29
-
30
-
31
-
32
-
33
-
34
-
35
-
36
-
37
-
38
-
39
-
40
-
41
-
42
-
43
-
44
-
45
-
46
-
47
-
48
-
49
-
50
-
51
-
52
-
53
-
54
-
55
-
56
-
57
-
58
-
59
-
60
-
61
-
62
-
63
-
64
-
65
-
66
-
67
-
68
-
69
-
70
-
71
-
72
-
73
-
74
-
75
-
76
-
77
-
78
-
79
-
80
-
81
-
82
-
83
-
84
-
85
-
86
-
87
-
88
-
89
-
90
-
91
-
92
-
93
-
94
-
95
-
96
-
97
-
98
-
99
-
100
-
101
-
102
-
103
-
104
-
 105
105 -
 106
106 -
 107
107 -
 108
108 -
 109
109 -
 110
110 -
 111
111 -
 112
112 -
 113
113 -
 114
114 -
 115
115 -
 116
116 -
 117
117 -
 118
118 -
 119
119 -
 120
120 -
 121
121 -
 122
122 -
 123
123 -
 124
124 -
 125
125 -
126
-
127
-
128
-
129
-
130
-
131
-
132
-
133
-
134
-
135
-
136
-
137
-
138
 |
 |

TIME WARNER INC.
NOTES TO CONSOLIDATED FINANCIAL STATEMENTS – (Continued)
Selected Information
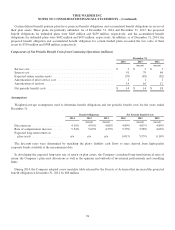
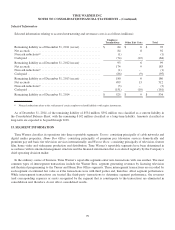
Selected information relating to accrued restructuring and severance costs is as follows (millions):
Employee
Terminations Other Exit Costs Total
Remaining liability as of December 31, 2011 (recast) ............. $ 84 $ 8 $ 92
Net accruals .............................................. 84 8 92
Noncash reductions(a) ....................................... (1) - (1)
Cash paid ................................................ (74) (10) (84)
Remaining liability as of December 31, 2012 (recast) ............. 93 6 99
Net accruals .............................................. 174 9 183
Noncash reductions(a) ....................................... (1) - (1)
Cash paid ................................................ (86) (9) (95)
Remaining liability as of December 31, 2013 (recast) ............. 180 6 186
Net accruals .............................................. 499 13 512
Noncash reductions(a) ....................................... (3) - (3)
Cash paid ................................................ (151) (10) (161)
Remaining liability as of December 31, 2014 .................... $ 525 $ 9 $ 534
(a) Noncash reductions relate to the settlement of certain employee-related liabilities with equity instruments.
As of December 31, 2014, of the remaining liability of $534 million, $392 million was classified as a current liability in
the Consolidated Balance Sheet, with the remaining $142 million classified as a long-term liability. Amounts classified as
long-term are expected to be paid through 2018.
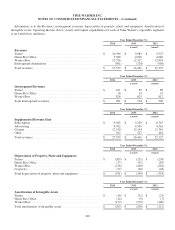
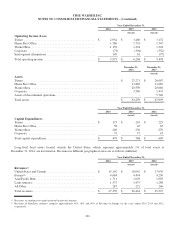
15. SEGMENT INFORMATION
Time Warner classifies its operations into three reportable segments: Turner: consisting principally of cable networks and
digital media properties; Home Box Office: consisting principally of premium pay television services domestically and
premium pay and basic tier television services internationally; and Warner Bros.: consisting principally of television, feature
film, home video and videogame production and distribution. Time Warner’s reportable segments have been determined in
accordance with its internal management structure and the financial information that is evaluated regularly by the Company’s
chief operating decision maker.
In the ordinary course of business, Time Warner’s reportable segments enter into transactions with one another. The most
common types of intersegment transactions include the Warner Bros. segment generating revenues by licensing television
and theatrical programming to the Turner and Home Box Office segments. These intersegment transactions are recorded by
each segment at estimated fair value as if the transactions were with third parties and, therefore, affect segment performance.
While intersegment transactions are treated like third-party transactions to determine segment performance, the revenues
(and corresponding expenses or assets recognized by the segment that is counterparty to the transaction) are eliminated in
consolidation and, therefore, do not affect consolidated results.
99