Time Magazine 2014 Annual Report Download - page 117
Download and view the complete annual report
Please find page 117 of the 2014 Time Magazine annual report below. You can navigate through the pages in the report by either clicking on the pages listed below, or by using the keyword search tool below to find specific information within the annual report.-
 1
1 -
2
-
3
-
4
-
5
-
6
-
7
-
8
-
9
-
10
-
11
-
12
-
13
-
14
-
15
-
16
-
17
-
18
-
19
-
20
-
21
-
22
-
23
-
24
-
25
-
26
-
27
-
28
-
29
-
30
-
31
-
32
-
33
-
34
-
35
-
36
-
37
-
38
-
39
-
40
-
41
-
42
-
43
-
44
-
45
-
46
-
47
-
48
-
49
-
50
-
51
-
52
-
53
-
54
-
55
-
56
-
57
-
58
-
59
-
60
-
61
-
62
-
63
-
64
-
65
-
66
-
67
-
68
-
69
-
70
-
71
-
72
-
73
-
74
-
75
-
76
-
77
-
78
-
79
-
80
-
81
-
82
-
83
-
84
-
85
-
86
-
87
-
88
-
89
-
90
-
91
-
92
-
93
-
94
-
95
-
96
-
97
-
98
-
99
-
100
-
101
-
102
-
103
-
104
-
105
-
106
-
 107
107 -
 108
108 -
 109
109 -
 110
110 -
 111
111 -
 112
112 -
 113
113 -
 114
114 -
 115
115 -
 116
116 -
 117
117 -
 118
118 -
 119
119 -
 120
120 -
 121
121 -
 122
122 -
 123
123 -
 124
124 -
 125
125 -
 126
126 -
 127
127 -
128
-
129
-
130
-
131
-
132
-
133
-
134
-
135
-
136
-
137
-
138
 |
 |

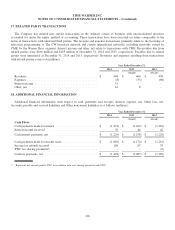
TIME WARNER INC.
NOTES TO CONSOLIDATED FINANCIAL STATEMENTS – (Continued)
Year Ended December 31,
2014 2013 2012
(recast) (recast)
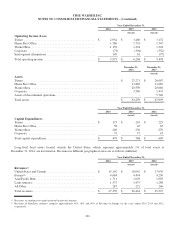
Operating Income (Loss)
Turner ............................................... $ 2,954 $ 3,486 $ 3,172
Home Box Office ...................................... 1,786 1,791 1,547
Warner Bros. .......................................... 1,159 1,324 1,228
Corporate ............................................ (73) (394) (352)
Intersegment eliminations ................................ 149 61 (97)
Total operating income .................................. $ 5,975 $ 6,268 $ 5,498
December 31,
2014
December 31,
2013
(recast)
Assets
Turner .............................................................. $ 25,271 $ 26,067
Home Box Office ..................................................... 13,869 13,687
Warner Bros. ......................................................... 20,559 20,066
Corporate ............................................................ 3,560 2,433
Assets of discontinued operations ......................................... - 5,746
Total assets .......................................................... $ 63,259 $ 67,999
Year Ended December 31,
2014 2013 2012
(recast) (recast)
Capital Expenditures
Turner ............................................... $ 173 $ 210 $ 229
Home Box Office ...................................... 58 45 65
Warner Bros. .......................................... 206 236 270
Corporate ............................................ 37 77 45
Total capital expenditures ................................ $ 474 $ 568 $ 609
Long-lived hard assets located outside the United States, which represent approximately 1% of total assets at
December 31, 2014, are not material. Revenues in different geographical areas are as follows (millions):
Year Ended December 31,
2014 2013 2012
(recast) (recast)
Revenues(a)
United States and Canada ................................ $ 19,102 $ 18,642 $ 17,936
Europe(b) ............................................. 4,684 4,494 4,250
Asia/Pacific Rim ....................................... 1,711 1,629 1,605
Latin America ......................................... 1,575 1,475 1,288
All Other ............................................. 287 221 246
Total revenues ......................................... $ 27,359 $ 26,461 $ 25,325
(a) Revenues are attributed to region based on location of customer.
(b) Revenues in EuroZone countries comprise approximately 48%, 48% and 49% of Revenues in Europe for the years ended 2014, 2013 and 2012,
respectively.
101