Time Magazine 2014 Annual Report Download - page 110
Download and view the complete annual report
Please find page 110 of the 2014 Time Magazine annual report below. You can navigate through the pages in the report by either clicking on the pages listed below, or by using the keyword search tool below to find specific information within the annual report.-
 1
1 -
2
-
3
-
4
-
5
-
6
-
7
-
8
-
9
-
10
-
11
-
12
-
13
-
14
-
15
-
16
-
17
-
18
-
19
-
20
-
21
-
22
-
23
-
24
-
25
-
26
-
27
-
28
-
29
-
30
-
31
-
32
-
33
-
34
-
35
-
36
-
37
-
38
-
39
-
40
-
41
-
42
-
43
-
44
-
45
-
46
-
47
-
48
-
49
-
50
-
51
-
52
-
53
-
54
-
55
-
56
-
57
-
58
-
59
-
60
-
61
-
62
-
63
-
64
-
65
-
66
-
67
-
68
-
69
-
70
-
71
-
72
-
73
-
74
-
75
-
76
-
77
-
78
-
79
-
80
-
81
-
82
-
83
-
84
-
85
-
86
-
87
-
88
-
89
-
90
-
91
-
92
-
93
-
94
-
95
-
96
-
97
-
98
-
99
-
 100
100 -
 101
101 -
 102
102 -
 103
103 -
 104
104 -
 105
105 -
 106
106 -
 107
107 -
 108
108 -
 109
109 -
 110
110 -
 111
111 -
 112
112 -
 113
113 -
 114
114 -
 115
115 -
 116
116 -
 117
117 -
 118
118 -
 119
119 -
 120
120 -
121
-
122
-
123
-
124
-
125
-
126
-
127
-
128
-
129
-
130
-
131
-
132
-
133
-
134
-
135
-
136
-
137
-
138
 |
 |

TIME WARNER INC.
NOTES TO CONSOLIDATED FINANCIAL STATEMENTS – (Continued)
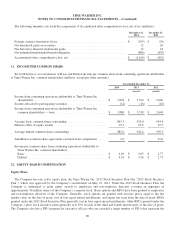
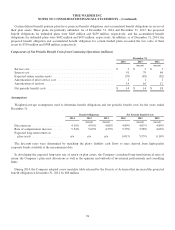
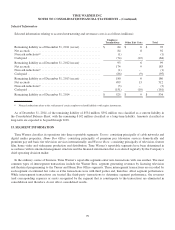
Certain defined benefit pension plans have projected benefit obligations and accumulated benefit obligations in excess of
their plan assets. These plans are primarily unfunded. As of December 31, 2014 and December 31, 2013, the projected
benefit obligations for unfunded plans were $449 million and $439 million, respectively, and the accumulated benefit
obligations for unfunded plans were $442 million and $433 million, respectively. In addition, as of December 31, 2014, the
projected benefit obligation and accumulated benefit obligation for certain funded plans exceeded the fair value of their
assets by $390 million and $388 million, respectively.
Components of Net Periodic Benefit Costs from Continuing Operations (millions)
December 31,
2014 2013 2012
(recast) (recast)
Service cost ....................................................... $ 3 $ 3 $ 3
Interest cost ....................................................... 91 79 84
Expected return on plan assets ........................................ (95) (85) (82)
Amortization of prior service cost ..................................... 1 1 1
Amortization of net loss ............................................. 14 16 12
Net periodic benefit costs ............................................ $ 14 $ 14 $ 18
Assumptions
Weighted-average assumptions used to determine benefit obligations and net periodic benefit costs for the years ended
December 31:
Benefit Obligations Net Periodic Benefit Costs
2014 2013 2012 2014 2013 2012
(recast) (recast) (recast) (recast)
Discount rate .................... 4.10% 4.90% 4.06% 4.89% 4.07% 4.89%
Rate of compensation increase ...... 5.34% 5.60% 4.59% 5.59% 3.98% 4.66%
Expected long-term return on
plan assets .................... n/a n/a n/a 6.01% 5.95% 6.14%
The discount rates were determined by matching the plan’s liability cash flows to rates derived from high-quality
corporate bonds available at the measurement date.
In developing the expected long-term rate of return on plan assets, the Company considered long-term historical rates of
return, the Company’s plan asset allocations as well as the opinions and outlooks of investment professionals and consulting
firms.
During 2014, the Company adopted a new mortality table released by the Society of Actuaries that increased the projected
benefit obligation at December 31, 2014 by $86 million.
94