Time Magazine 2014 Annual Report Download - page 105
Download and view the complete annual report
Please find page 105 of the 2014 Time Magazine annual report below. You can navigate through the pages in the report by either clicking on the pages listed below, or by using the keyword search tool below to find specific information within the annual report.-
 1
1 -
2
-
3
-
4
-
5
-
6
-
7
-
8
-
9
-
10
-
11
-
12
-
13
-
14
-
15
-
16
-
17
-
18
-
19
-
20
-
21
-
22
-
23
-
24
-
25
-
26
-
27
-
28
-
29
-
30
-
31
-
32
-
33
-
34
-
35
-
36
-
37
-
38
-
39
-
40
-
41
-
42
-
43
-
44
-
45
-
46
-
47
-
48
-
49
-
50
-
51
-
52
-
53
-
54
-
55
-
56
-
57
-
58
-
59
-
60
-
61
-
62
-
63
-
64
-
65
-
66
-
67
-
68
-
69
-
70
-
71
-
72
-
73
-
74
-
75
-
76
-
77
-
78
-
79
-
80
-
81
-
82
-
83
-
84
-
85
-
86
-
87
-
88
-
89
-
90
-
91
-
92
-
93
-
94
-
 95
95 -
 96
96 -
 97
97 -
 98
98 -
 99
99 -
 100
100 -
 101
101 -
 102
102 -
 103
103 -
 104
104 -
 105
105 -
 106
106 -
 107
107 -
 108
108 -
 109
109 -
 110
110 -
 111
111 -
 112
112 -
 113
113 -
 114
114 -
 115
115 -
116
-
117
-
118
-
119
-
120
-
121
-
122
-
123
-
124
-
125
-
126
-
127
-
128
-
129
-
130
-
131
-
132
-
133
-
134
-
135
-
136
-
137
-
138
 |
 |

TIME WARNER INC.
NOTES TO CONSOLIDATED FINANCIAL STATEMENTS – (Continued)
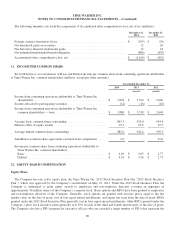
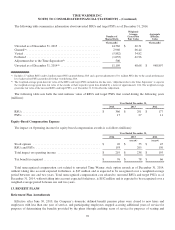
The following summary sets forth the components of Accumulated other comprehensive loss, net of tax (millions):
December 31,
2014
December 31,
2013
Foreign currency translation losses ............................................ $ (299) $ (26)
Net unrealized gains on securities ............................................. 12 26
Net derivative financial instruments gains ....................................... 12 18
Net unfunded/underfunded benefit obligation .................................... (889) (870)
Accumulated other comprehensive loss, net ..................................... $ (1,164) $ (852)
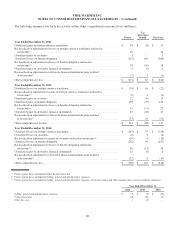
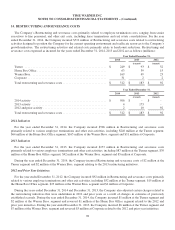
11. INCOME PER COMMON SHARE
Set forth below is a reconciliation of Basic and Diluted income per common share from continuing operations attributable
to Time Warner Inc. common shareholders (millions, except per share amounts):
Year Ended December 31,
2014 2013 2012
(recast) (recast)
Income from continuing operations attributable to Time Warner Inc.
shareholders: ............................................... $ 3,894 $ 3,354 $ 2,666
Income allocated to participating securities ......................... (14) (16) (18)
Income from continuing operations attributable to Time Warner Inc.
common shareholders — basic ................................. $ 3,880 $ 3,338 $ 2,648
Average basic common shares outstanding ......................... 863.3 920.0 954.4
Dilutive effect of equity awards .................................. 19.3 22.6 21.9
Average diluted common shares outstanding ........................ 882.6 942.6 976.3
Antidilutive common share equivalents excluded from computation ..... 1.0 - 25.0
Income per common share from continuing operations attributable to
Time Warner Inc. common shareholders:
Basic ..................................................... $ 4.49 $ 3.63 $ 2.77
Diluted ................................................... $ 4.41 $ 3.56 $ 2.73
12. EQUITY-BASED COMPENSATION
Equity Plans
The Company has one active equity plan, the Time Warner Inc. 2013 Stock Incentive Plan (the “2013 Stock Incentive
Plan”), which was approved by the Company’s stockholders on May 23, 2013. Under the 2013 Stock Incentive Plan, the
Company is authorized to grant equity awards to employees and non-employee directors covering an aggregate of
approximately 36 million shares of the Company’s common stock. Stock options and RSUs have been granted to employees
and non-employee directors of the Company. Generally, stock options are granted with exercise prices equal to the fair
market value on the date of grant, vest in four equal annual installments, and expire ten years from the date of grant. RSUs
granted under the 2013 Stock Incentive Plan generally vest in four equal annual installments, while RSUs granted under the
Company’s prior stock incentive plans generally vest 50% in each of the third and fourth anniversaries of the date of grant.
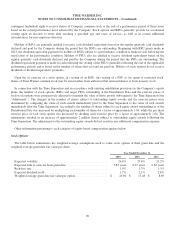
The Company also has a PSU program for executive officers who are awarded a target number of PSUs that represent the
89