Time Magazine 2014 Annual Report Download - page 116
Download and view the complete annual report
Please find page 116 of the 2014 Time Magazine annual report below. You can navigate through the pages in the report by either clicking on the pages listed below, or by using the keyword search tool below to find specific information within the annual report.-
 1
1 -
2
-
3
-
4
-
5
-
6
-
7
-
8
-
9
-
10
-
11
-
12
-
13
-
14
-
15
-
16
-
17
-
18
-
19
-
20
-
21
-
22
-
23
-
24
-
25
-
26
-
27
-
28
-
29
-
30
-
31
-
32
-
33
-
34
-
35
-
36
-
37
-
38
-
39
-
40
-
41
-
42
-
43
-
44
-
45
-
46
-
47
-
48
-
49
-
50
-
51
-
52
-
53
-
54
-
55
-
56
-
57
-
58
-
59
-
60
-
61
-
62
-
63
-
64
-
65
-
66
-
67
-
68
-
69
-
70
-
71
-
72
-
73
-
74
-
75
-
76
-
77
-
78
-
79
-
80
-
81
-
82
-
83
-
84
-
85
-
86
-
87
-
88
-
89
-
90
-
91
-
92
-
93
-
94
-
95
-
96
-
97
-
98
-
99
-
100
-
101
-
102
-
103
-
104
-
105
-
 106
106 -
 107
107 -
 108
108 -
 109
109 -
 110
110 -
 111
111 -
 112
112 -
 113
113 -
 114
114 -
 115
115 -
 116
116 -
 117
117 -
 118
118 -
 119
119 -
 120
120 -
 121
121 -
 122
122 -
 123
123 -
 124
124 -
 125
125 -
 126
126 -
127
-
128
-
129
-
130
-
131
-
132
-
133
-
134
-
135
-
136
-
137
-
138
 |
 |

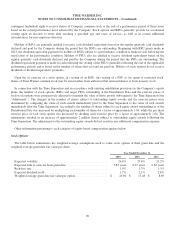
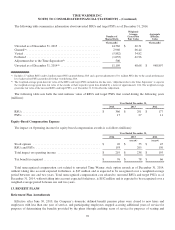
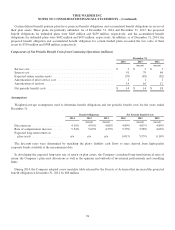
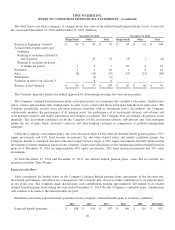
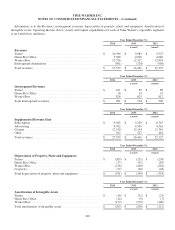
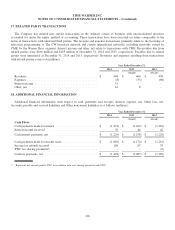
TIME WARNER INC.
NOTES TO CONSOLIDATED FINANCIAL STATEMENTS – (Continued)
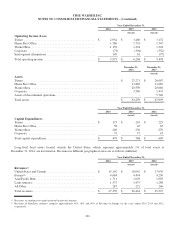
Information as to the Revenues, intersegment revenues, depreciation of property, plant, and equipment, Amortization of
intangible assets, Operating Income (Loss), Assets and Capital expenditures for each of Time Warner’s reportable segments
is set forth below (millions):
Year Ended December 31,
2014 2013 2012
(recast) (recast)
Revenues
Turner .................................................. $ 10,396 $ 9,983 $ 9,527
Home Box Office .......................................... 5,398 4,890 4,686
Warner Bros. ............................................. 12,526 12,312 12,018
Intersegment eliminations ................................... (961) (724) (906)
Total revenues ............................................ $ 27,359 $ 26,461 $ 25,325
Year Ended December 31,
2014 2013 2012
(recast) (recast)
Intersegment Revenues
Turner .................................................. $ 101 $ 85 $ 80
Home Box Office .......................................... 36 14 14
Warner Bros. ............................................. 824 625 812
Total intersegment revenues ................................. $ 961 $ 724 $ 906
Year Ended December 31,
2014 2013 2012
(recast) (recast)
Supplemental Revenue Data
Subscription .............................................. $ 9,945 $ 9,250 $ 8,787
Advertising .............................................. 4,502 4,530 4,316
Content .................................................. 12,350 12,154 11,741
Other ................................................... 562 527 481
Total revenues ............................................ $ 27,359 $ 26,461 $ 25,325
Year Ended December 31,
2014 2013 2012
(recast) (recast)
Depreciation of Property, Plant and Equipment
Turner .................................................. $ (209) $ (231) $ (238)
Home Box Office .......................................... (77) (91) (85)
Warner Bros. ............................................. (218) (200) (202)
Corporate ................................................ (27) (28) (28)
Total depreciation of property, plant and equipment .............. $ (531) $ (550) $ (553)
Year Ended December 31,
2014 2013 2012
(recast) (recast)
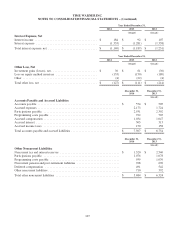
Amortization of Intangible Assets
Turner .................................................. $ (16) $ (21) $ (25)
Home Box Office .......................................... (14) (9) (7)
Warner Bros. ............................................. (172) (179) (180)
Total amortization of intangible assets ......................... $ (202) $ (209) $ (212)
100