Time Magazine 2014 Annual Report Download - page 52
Download and view the complete annual report
Please find page 52 of the 2014 Time Magazine annual report below. You can navigate through the pages in the report by either clicking on the pages listed below, or by using the keyword search tool below to find specific information within the annual report.-
 1
1 -
2
-
3
-
4
-
5
-
6
-
7
-
8
-
9
-
10
-
11
-
12
-
13
-
14
-
15
-
16
-
17
-
18
-
19
-
20
-
21
-
22
-
23
-
24
-
25
-
26
-
27
-
28
-
29
-
30
-
31
-
32
-
33
-
34
-
35
-
36
-
37
-
38
-
39
-
40
-
41
-
 42
42 -
 43
43 -
 44
44 -
 45
45 -
 46
46 -
 47
47 -
 48
48 -
 49
49 -
 50
50 -
 51
51 -
 52
52 -
 53
53 -
 54
54 -
 55
55 -
 56
56 -
 57
57 -
 58
58 -
 59
59 -
 60
60 -
 61
61 -
 62
62 -
63
-
64
-
65
-
66
-
67
-
68
-
69
-
70
-
71
-
72
-
73
-
74
-
75
-
76
-
77
-
78
-
79
-
80
-
81
-
82
-
83
-
84
-
85
-
86
-
87
-
88
-
89
-
90
-
91
-
92
-
93
-
94
-
95
-
96
-
97
-
98
-
99
-
100
-
101
-
102
-
103
-
104
-
105
-
106
-
107
-
108
-
109
-
110
-
111
-
112
-
113
-
114
-
115
-
116
-
117
-
118
-
119
-
120
-
121
-
122
-
123
-
124
-
125
-
126
-
127
-
128
-
129
-
130
-
131
-
132
-
133
-
134
-
135
-
136
-
137
-
138
 |
 |

TIME WARNER INC.
MANAGEMENT’S DISCUSSION AND ANALYSIS
OF RESULTS OF OPERATIONS AND FINANCIAL CONDITION – (Continued)
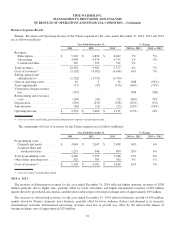
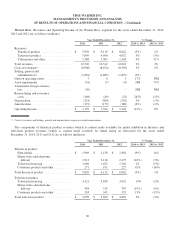
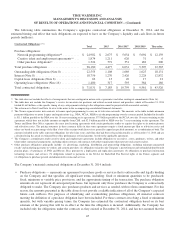
Warner Bros. Revenues and Operating Income of the Warner Bros. segment for the years ended December 31, 2014,
2013 and 2012 are as follows (millions):
Year Ended December 31, % Change
2014 2013 2012 2014 vs. 2013 2013 vs. 2012
Revenues:
Theatrical product .................... $ 5,839 $ 6,119 $ 6,042 (5%) 1%
Television product .................... 5,099 4,690 4,832 9% (3%)
Videogames and other ................. 1,588 1,503 1,144 6% 31%
Total revenues ......................... 12,526 12,312 12,018 2% 2%
Costs of revenues(a) ..................... (8,906) (8,674) (8,503) 3% 2%
Selling, general and
administrative(a) ...................... (1,832) (1,885) (1,879) (3%) -
Gain on operating assets ................. 7 6 1 17% NM
Asset impairments ...................... (41) (7) (4) NM 75%
Venezuelan foreign currency
loss ................................ (36) - - NM NM
Restructuring and severance
costs ............................... (169) (49) (23) 245% 113%
Depreciation ........................... (218) (200) (202) 9% (1%)
Amortization .......................... (172) (179) (180) (4%) (1%)
Operating Income ....................... $ 1,159 $ 1,324 $ 1,228 (12%) 8%
(a) Costs of revenues and Selling, general and administrative expenses exclude depreciation.
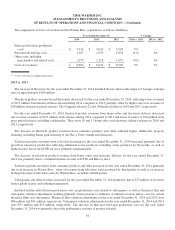
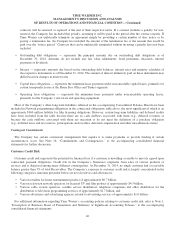
The components of theatrical product revenues (which is content made available for initial exhibition in theaters) and
television product revenues (which is content made available for initial airing on television) for the years ended
December 31, 2014, 2013 and 2012 are as follows (millions):
Year Ended December 31, % Change
2014 2013 2012 2014 vs. 2013 2013 vs. 2012
Theatrical product:
Film rentals ......................... $ 1,969 $ 2,158 $ 1,894 (9%) 14%
Home video and electronic
delivery .......................... 1,913 2,118 2,175 (10%) (3%)
Television licensing ................... 1,686 1,652 1,746 2% (5%)
Consumer products and other ........... 271 191 227 42% (16%)
Total theatrical product .................. $ 5,839 $ 6,119 $ 6,042 (5%) 1%
Television product:
Television licensing ................... 4,121 3,628 3,652 14% (1%)
Home video and electronic
delivery .......................... 584 719 787 (19%) (9%)
Consumer products and other ........... 394 343 393 15% (13%)
Total television product .................. $ 5,099 $ 4,690 $ 4,832 9% (3%)
36