Time Magazine 2014 Annual Report Download - page 112
Download and view the complete annual report
Please find page 112 of the 2014 Time Magazine annual report below. You can navigate through the pages in the report by either clicking on the pages listed below, or by using the keyword search tool below to find specific information within the annual report.-
 1
1 -
2
-
3
-
4
-
5
-
6
-
7
-
8
-
9
-
10
-
11
-
12
-
13
-
14
-
15
-
16
-
17
-
18
-
19
-
20
-
21
-
22
-
23
-
24
-
25
-
26
-
27
-
28
-
29
-
30
-
31
-
32
-
33
-
34
-
35
-
36
-
37
-
38
-
39
-
40
-
41
-
42
-
43
-
44
-
45
-
46
-
47
-
48
-
49
-
50
-
51
-
52
-
53
-
54
-
55
-
56
-
57
-
58
-
59
-
60
-
61
-
62
-
63
-
64
-
65
-
66
-
67
-
68
-
69
-
70
-
71
-
72
-
73
-
74
-
75
-
76
-
77
-
78
-
79
-
80
-
81
-
82
-
83
-
84
-
85
-
86
-
87
-
88
-
89
-
90
-
91
-
92
-
93
-
94
-
95
-
96
-
97
-
98
-
99
-
100
-
101
-
 102
102 -
 103
103 -
 104
104 -
 105
105 -
 106
106 -
 107
107 -
 108
108 -
 109
109 -
 110
110 -
 111
111 -
 112
112 -
 113
113 -
 114
114 -
 115
115 -
 116
116 -
 117
117 -
 118
118 -
 119
119 -
 120
120 -
 121
121 -
 122
122 -
123
-
124
-
125
-
126
-
127
-
128
-
129
-
130
-
131
-
132
-
133
-
134
-
135
-
136
-
137
-
138
 |
 |

TIME WARNER INC.
NOTES TO CONSOLIDATED FINANCIAL STATEMENTS – (Continued)
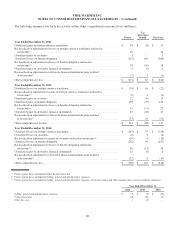
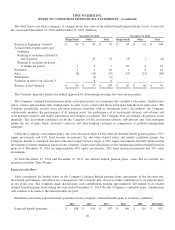
The table below sets forth a summary of changes in the fair value of the defined benefit pension plans’ Level 3 assets for
the years ended December 31, 2014 and December 31, 2013 (millions):
December 31, 2014 December 31, 2013
Hedge Funds Other Total Hedge Funds Other Total
Balance at beginning of period ...... $ 36 $ 40 $ 76 $ 63 $ 41 $ 104
Actual return on plan assets and
liabilities:
Relating to securities still held at
end of period ................ - 31 31 (5) 1 (4)
Relating to securities disposed
of during the period ........... 1 6 7 10 4 14
Purchases ....................... 1 9 10 1 9 10
Sales ........................... (8) (15) (23) (33) (15) (48)
Settlements ...................... - (2) (2) - - -
Transfers in and/or out of Level 3 .... - 8 8 - - -
Balance at end of period ........... $ 30 $ 77 $ 107 $ 36 $ 40 $ 76
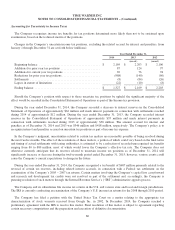
The Company primarily utilizes the market approach for determining recurring fair value measurements.
The Company’s defined benefit pension plans’ investment policy is to minimize the volatility of the plans’ funded status
and to achieve and maintain fully funded status in order to pay current and future participant benefits from plan assets. The
Company periodically reviews asset allocation policies consistent with its investment policy. In addition, the Company
continuously monitors the performance of its pension assets, the performance of its investment advisers, sub-advisers and
asset managers thereof, and makes adjustments and changes as required. The Company does not manage any pension assets
internally. The investment guidelines set by the Company for the investment advisers, sub-advisers and asset managers
permit the use of index funds, derivative contracts and other hedging strategies as components of portfolio management
strategies.
Under the Company’s investment policy, the asset allocation target for the domestic defined benefit pension plans is 35%
equity investments and 65% fixed income investments. As and when funded status and market conditions permit, the
Company intends to transition this asset allocation target toward a target of 20% equity investments and 80% fixed income
investments to further minimize funded status volatility. Target asset allocations for the international defined benefit pension
plans as of December 31, 2014 are approximately 45% equity investments, 20% fixed income investments and 35% other
investments.
At both December 31, 2014 and December 31, 2013, the defined benefit pension plans’ assets did not include any
securities issued by Time Warner.
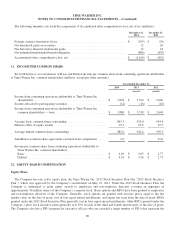
Expected cash flows
After considering the funded status of the Company’s defined benefit pension plans, movements in the discount rate,
investment performance and related tax consequences, the Company may choose to make contributions to its pension plans
in any given year. The Company made discretionary cash contributions totaling approximately $20 million to its funded
defined benefit pension plans during the year ended December 31, 2014. For the Company’s unfunded plans, contributions
will continue to be made to the extent benefits are paid.
Information about the expected benefit payments for the Company’s defined benefit plans is as follows (millions):
2015 2016 2017 2018 2019 2020-2024
Expected benefit payments ......... $ 188 $ 195 $ 197 $ 196 $ 191 $ 992
96