Time Magazine 2014 Annual Report Download - page 50
Download and view the complete annual report
Please find page 50 of the 2014 Time Magazine annual report below. You can navigate through the pages in the report by either clicking on the pages listed below, or by using the keyword search tool below to find specific information within the annual report.-
 1
1 -
2
-
3
-
4
-
5
-
6
-
7
-
8
-
9
-
10
-
11
-
12
-
13
-
14
-
15
-
16
-
17
-
18
-
19
-
20
-
21
-
22
-
23
-
24
-
25
-
26
-
27
-
28
-
29
-
30
-
31
-
32
-
33
-
34
-
35
-
36
-
37
-
38
-
39
-
 40
40 -
 41
41 -
 42
42 -
 43
43 -
 44
44 -
 45
45 -
 46
46 -
 47
47 -
 48
48 -
 49
49 -
 50
50 -
 51
51 -
 52
52 -
 53
53 -
 54
54 -
 55
55 -
 56
56 -
 57
57 -
 58
58 -
 59
59 -
 60
60 -
61
-
62
-
63
-
64
-
65
-
66
-
67
-
68
-
69
-
70
-
71
-
72
-
73
-
74
-
75
-
76
-
77
-
78
-
79
-
80
-
81
-
82
-
83
-
84
-
85
-
86
-
87
-
88
-
89
-
90
-
91
-
92
-
93
-
94
-
95
-
96
-
97
-
98
-
99
-
100
-
101
-
102
-
103
-
104
-
105
-
106
-
107
-
108
-
109
-
110
-
111
-
112
-
113
-
114
-
115
-
116
-
117
-
118
-
119
-
120
-
121
-
122
-
123
-
124
-
125
-
126
-
127
-
128
-
129
-
130
-
131
-
132
-
133
-
134
-
135
-
136
-
137
-
138
 |
 |

TIME WARNER INC.
MANAGEMENT’S DISCUSSION AND ANALYSIS
OF RESULTS OF OPERATIONS AND FINANCIAL CONDITION – (Continued)
For the year ended December 31, 2013, Restructuring and severance costs increased due largely to higher severance costs.
The increase in Operating Income for the year ended December 31, 2013 was primarily due to higher Revenues and lower
asset impairments, partially offset by higher Costs of revenues, higher Restructuring and severance costs and lower Gains on
operating assets.
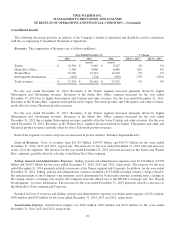
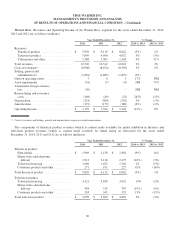
Home Box Office. Revenues and Operating Income of the Home Box Office segment for the years ended December 31,
2014, 2013 and 2012 are as follows (millions):
Year Ended December 31, % Change
2014 2013 2012 2014 vs. 2013 2013 vs. 2012
Revenues:
Subscription .................... $ 4,578 $ 4,231 $ 4,010 8% 6%
Content and other ................ 820 659 676 24% (3%)
Total revenues .................... 5,398 4,890 4,686 10% 4%
Costs of revenues(a) ................ (2,708) (2,368) (2,400) 14% (1%)
Selling, general and
administrative(a) ................. (746) (705) (632) 6% 12%
Gain on operating assets ............ - 113 - (100%) NM
Asset impairments ................. (4) - - NM NM
Restructuring and severance
costs .......................... (63) (39) (15) 62% 160%
Depreciation ...................... (77) (91) (85) (15%) 7%
Amortization ..................... (14) (9) (7) 56% 29%
Operating Income ................. $ 1,786 $ 1,791 $ 1,547 - 16%
(a) Costs of revenues and Selling, general and administrative expenses exclude depreciation.
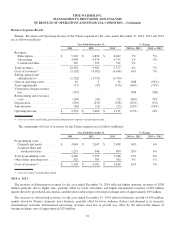
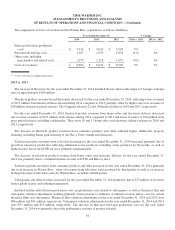
The components of Costs of revenues for the Home Box Office segment are as follows (millions):
Year Ended December 31, % Change
2014 2013 2012 2014 vs. 2013 2013 vs. 2012
Programming costs:
Acquired films and
syndicated series .............. $ 1,007 $ 894 $ 885 13% 1%
Originals and sports .............. 960 856 856 12% -
Total programming costs ............ 1,967 1,750 1,741 12% 1%
Other direct operating costs .......... 741 618 659 20% (6%)
Costs of revenues(a) ................ $ 2,708 $ 2,368 $ 2,400 14% (1%)
(a) Costs of revenues exclude depreciation.
2014 vs. 2013
The increase in Subscription revenues for the year ended December 31, 2014 was primarily due to higher domestic
subscription revenues of $198 million driven mainly by higher contractual rates and higher revenues of $146 million at HBO
Asia and HBO Nordic primarily due to their consolidations in September 2013 and June 2013, respectively.
The increase in Content and other revenues for the year ended December 31, 2014 was primarily due to higher worldwide
licensing revenues from original programming of $116 million, primarily relating to the licensing of select original
programming to an SVOD service, and higher home entertainment revenues of $71 million.
34