The Hartford 2010 Annual Report Download - page 99
Download and view the complete annual report
Please find page 99 of the 2010 The Hartford annual report below. You can navigate through the pages in the report by either clicking on the pages listed below, or by using the keyword search tool below to find specific information within the annual report.-
 1
1 -
2
-
3
-
4
-
5
-
6
-
7
-
8
-
9
-
10
-
11
-
12
-
13
-
14
-
15
-
16
-
17
-
18
-
19
-
20
-
21
-
22
-
23
-
24
-
25
-
26
-
27
-
28
-
29
-
30
-
31
-
32
-
33
-
34
-
35
-
36
-
37
-
38
-
39
-
40
-
41
-
42
-
43
-
44
-
45
-
46
-
47
-
48
-
49
-
50
-
51
-
52
-
53
-
54
-
55
-
56
-
57
-
58
-
59
-
60
-
61
-
62
-
63
-
64
-
65
-
66
-
67
-
68
-
69
-
70
-
71
-
72
-
73
-
74
-
75
-
76
-
77
-
78
-
79
-
80
-
81
-
82
-
83
-
84
-
85
-
86
-
87
-
88
-
 89
89 -
 90
90 -
 91
91 -
 92
92 -
 93
93 -
 94
94 -
 95
95 -
 96
96 -
 97
97 -
 98
98 -
 99
99 -
 100
100 -
 101
101 -
 102
102 -
 103
103 -
 104
104 -
 105
105 -
 106
106 -
 107
107 -
 108
108 -
 109
109 -
110
-
111
-
112
-
113
-
114
-
115
-
116
-
117
-
118
-
119
-
120
-
121
-
122
-
123
-
124
-
125
-
126
-
127
-
128
-
129
-
130
-
131
-
132
-
133
-
134
-
135
-
136
-
137
-
138
-
139
-
140
-
141
-
142
-
143
-
144
-
145
-
146
-
147
-
148
-
149
-
150
-
151
-
152
-
153
-
154
-
155
-
156
-
157
-
158
-
159
-
160
-
161
-
162
-
163
-
164
-
165
-
166
-
167
-
168
-
169
-
170
-
171
-
172
-
173
-
174
-
175
-
176
-
177
-
178
-
179
-
180
-
181
-
182
-
183
-
184
-
185
-
186
-
187
-
188
-
189
-
190
-
191
-
192
-
193
-
194
-
195
-
196
-
197
-
198
-
199
-
200
-
201
-
202
-
203
-
204
-
205
-
206
-
207
-
208
-
209
-
210
-
211
-
212
-
213
-
214
-
215
-
216
-
217
-
218
-
219
-
220
-
221
-
222
-
223
-
224
-
225
-
226
-
227
-
228
-
229
-
230
-
231
-
232
-
233
-
234
-
235
-
236
-
237
-
238
-
239
-
240
-
241
-
242
-
243
-
244
-
245
-
246
-
247
-
248
 |
 |

99
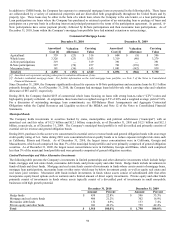
The loan-by-loan collateral review is performed to estimate potential future losses. This review incorporates assumptions about
expected future collateral cash flows, including projected rental rates and occupancy levels that varied based on property type and sub-
market. The results of the loan by loan collateral review allowed the Company to estimate the expected timing of a security’ s first loss,
if any, and the probability and severity of potential ultimate losses. The Company then discounted these anticipated future cash flows at
the security’ s book yield prior to impairment. The results of cash flow modeling utilized by the Company result in cumulative collateral
loss rates that vary by vintage year. For the 2007 vintage year, the Company’ s cash flow modeling resulted in cumulative collateral loss
rates for CMBS and sub-prime RMBS of approximately 12% and 44%, respectively.
Impairments on securities for which the Company had the intent to sell were primarily on CMBS bonds in order to take advantage of
price appreciation. Impairments on equity securities were primarily on below investment grade securities that have been depressed 20%
for more than six months.
In addition to the credit impairments recognized in earnings, the Company recognized non-credit impairments in other comprehensive
income of $418 for the year ended December 31, 2010, predominantly concentrated in CRE CDOs and RMBS. These non-credit
impairments represent the difference between fair value and the Company’ s best estimate of expected future cash flows discounted at
the security’ s effective yield prior to impairment, rather than at current market implied credit spreads. These non-credit impairments
primarily represent increases in market liquidity premiums and credit spread widening that occurred after the securities were purchased,
as well as a discount for variable-rate coupons which are paying less than at purchase date. In general, larger liquidity premiums and
wider credit spreads are the result of deterioration of the underlying collateral performance of the securities, as well as the risk premium
required to reflect future uncertainty in the real estate market.
Future impairments may develop as the result of changes in intent to sell of specific securities or if actual results underperform current
modeling assumptions, which may be the result of, but are not limited to, macroeconomic factors, and property performance below
current expectations. Recent improvements in commercial real estate property valuations will positively impact future loss
development, with future impairments driven by idiosyncratic security specific risk.
Year ended December 31, 2009
Impairments recognized in earnings were comprised of credit impairments of $1.2 billion primarily concentrated on CRE CDOs, below-
prime RMBS and CMBS bonds. Also included were impairments on debt securities for which the Company intended to sell of $156,
mainly comprised of corporate financial services securities, as well as impairments on equity securities of $136 related to below
investment grade hybrid securities.
Year ended December 31, 2008
Impairments were primarily concentrated on subordinated fixed maturities and preferred equities within the financial services sector, as
well as in sub-prime RMBS and CRE CDOs. The remaining impairments were primarily recorded on securities in various sectors that
experienced significant credit spread widening and for which the Company was uncertain of its intent to retain the investments for a
period of time sufficient to allow for recovery.
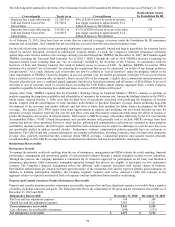
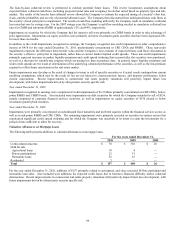
Valuation Allowances on Mortgage Loans
The following table presents additions to valuation allowances on mortgage loans.
For the years ended December 31,
2010 2009 2008
Credit-related concerns $70 $ 310 $ 26
Held for sale
Agricultural loans 10 4 ––
B-note participations 22 51 ––
Mezzanine loans 52 43 ––
Residential 3 –– ––
Total $157 $ 408 $ 26
For the year ended December 31, 2010, additions of $157 primarily related to anticipated, and since executed, B-Note participant and
mezzanine loan sales. Also included were additions for expected credit losses due to borrower financial difficulty and/or collateral
deterioration. Recent improvements in commercial real estate property valuations will positively impact future loss development, with
future impairments driven by idiosyncratic security specific risk.