The Hartford 2010 Annual Report Download - page 177
Download and view the complete annual report
Please find page 177 of the 2010 The Hartford annual report below. You can navigate through the pages in the report by either clicking on the pages listed below, or by using the keyword search tool below to find specific information within the annual report.-
 1
1 -
2
-
3
-
4
-
5
-
6
-
7
-
8
-
9
-
10
-
11
-
12
-
13
-
14
-
15
-
16
-
17
-
18
-
19
-
20
-
21
-
22
-
23
-
24
-
25
-
26
-
27
-
28
-
29
-
30
-
31
-
32
-
33
-
34
-
35
-
36
-
37
-
38
-
39
-
40
-
41
-
42
-
43
-
44
-
45
-
46
-
47
-
48
-
49
-
50
-
51
-
52
-
53
-
54
-
55
-
56
-
57
-
58
-
59
-
60
-
61
-
62
-
63
-
64
-
65
-
66
-
67
-
68
-
69
-
70
-
71
-
72
-
73
-
74
-
75
-
76
-
77
-
78
-
79
-
80
-
81
-
82
-
83
-
84
-
85
-
86
-
87
-
88
-
89
-
90
-
91
-
92
-
93
-
94
-
95
-
96
-
97
-
98
-
99
-
100
-
101
-
102
-
103
-
104
-
105
-
106
-
107
-
108
-
109
-
110
-
111
-
112
-
113
-
114
-
115
-
116
-
117
-
118
-
119
-
120
-
121
-
122
-
123
-
124
-
125
-
126
-
127
-
128
-
129
-
130
-
131
-
132
-
133
-
134
-
135
-
136
-
137
-
138
-
139
-
140
-
141
-
142
-
143
-
144
-
145
-
146
-
147
-
148
-
149
-
150
-
151
-
152
-
153
-
154
-
155
-
156
-
157
-
158
-
159
-
160
-
161
-
162
-
163
-
164
-
165
-
166
-
 167
167 -
 168
168 -
 169
169 -
 170
170 -
 171
171 -
 172
172 -
 173
173 -
 174
174 -
 175
175 -
 176
176 -
 177
177 -
 178
178 -
 179
179 -
 180
180 -
 181
181 -
 182
182 -
 183
183 -
 184
184 -
 185
185 -
 186
186 -
 187
187 -
188
-
189
-
190
-
191
-
192
-
193
-
194
-
195
-
196
-
197
-
198
-
199
-
200
-
201
-
202
-
203
-
204
-
205
-
206
-
207
-
208
-
209
-
210
-
211
-
212
-
213
-
214
-
215
-
216
-
217
-
218
-
219
-
220
-
221
-
222
-
223
-
224
-
225
-
226
-
227
-
228
-
229
-
230
-
231
-
232
-
233
-
234
-
235
-
236
-
237
-
238
-
239
-
240
-
241
-
242
-
243
-
244
-
245
-
246
-
247
-
248
 |
 |

THE HARTFORD FINANCIAL SERVICES GROUP, INC.
NOTES TO CONSOLIDATED FINANCIAL STATEMENTS (continued)
F-49
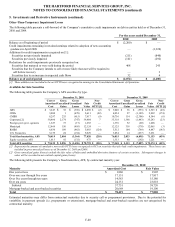
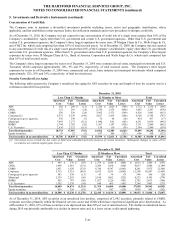
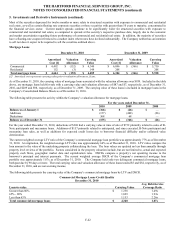
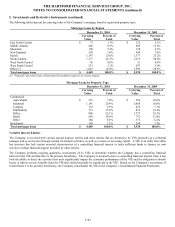
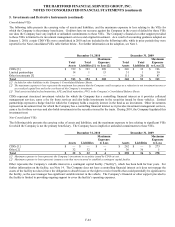
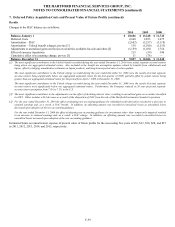
5. Investments and Derivative Instruments (continued)
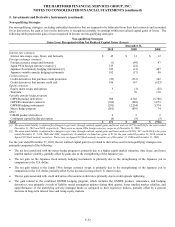
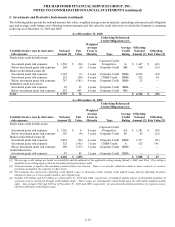
Derivative Balance Sheet Classification
The table below summarizes the balance sheet classification of the Company’ s derivative related fair value amounts, as well as the gross
asset and liability fair value amounts. The fair value amounts presented do not include income accruals or cash collateral held amounts,
which are netted with derivative fair value amounts to determine balance sheet presentation. Derivatives in the Company’ s separate
accounts are not included because the associated gains and losses accrue directly to policyholders. The Company’ s derivative
instruments are held for risk management purposes, unless otherwise noted in the table below. The notional amount of derivative
contracts represents the basis upon which pay or receive amounts are calculated and is presented in the table to quantify the volume of
the Company’ s derivative activity. Notional amounts are not necessarily reflective of credit risk.
Net Derivatives
Asset Derivatives Liability Derivatives
Notional Amount Fair Value Fair Value Fair Value
Hedge Designation/ Derivative Type
Dec. 31,
2010
Dec. 31,
2009
Dec. 31,
2010
Dec. 31,
2009
Dec. 31,
2010
Dec. 31,
2009
Dec. 31,
2010
Dec. 31,
2009
Cash flow hedges
Interest rate swaps $ 10,290 $ 11,170 $ 115 $ 123 $ 188 $ 294 $ (73) $ (171)
Forward rate agreements — 6,355 — — — — — —
Foreign currency swaps 335 381 6 (3) 29 30 (23) (33)
Total cash flow hedges 10,625 17,906 121 120 217 324 (96) (204)
Fair value hedges
Interest rate swaps 1,120 1,745 (46) (21) 5 16 (51) (37)
Foreign currency swaps 677 696 (12) (9) 71 53 (83) (62)
Total fair value hedges 1,797 2,441 (58) (30) 76 69 (134) (99)
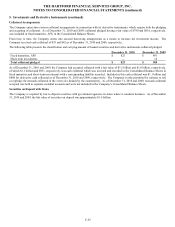
Non-qualifying strategies
Interest rate contracts
Interest rate swaps, caps, floors, and futures 7,938 8,355 (441) (84) 126 250 (567) (334)
Foreign exchange contracts
Foreign currency swaps and forwards 368 1,039 (18) (13) 1 14 (19) (27)
Japan 3Win foreign currency swaps 2,285 2,514 177 (19) 177 35 — (54)
Japanese fixed annuity hedging instruments 2,119 2,271 608 316 608 319 — (3)
Japanese variable annuity hedging instruments 1,720 257 73 (8) 74 — (1) (8)
Credit contracts
Credit derivatives that purchase credit
protection 2,559 2,606 (9) (50) 29 45 (38) (95)
Credit derivatives that assume credit risk [1] 2,569 1,158 (434) (240) 8 2 (442) (242)
Credit derivatives in offsetting positions 8,367 6,176 (75) (71) 98 185 (173) (256)
Equity contracts
Equity index swaps and options 189 220 (10) (16) 5 3 (15) (19)
Variable annuity hedge program
GMWB product derivatives [2] 42,739 47,329 (1,647) (2,002) — — (1,647) (2,002)
GMWB reinsurance contracts 8,767 10,301 280 347 280 347 — —
GMWB hedging instruments 17,856 15,567 467 52 647 264 (180) (212)
Macro hedge program 26,210 27,448 384 318 394 558 (10) (240)
Other
GMAB product derivatives [2] 246 226 3 2 3 2 — —
Contingent capital facility put option 500 500 32 36 32 36 — —
Total non-qualifying strategies 124,432 125,967 (610) (1,432) 2,482 2,060 (3,092) (3,492)
Total cash flow hedges, fair value hedges, and
non-qualifying strategies $ 136,854 $ 146,314 $ (547) $ (1,342) $ 2,775 $ 2,453 $ (3,322) $ (3,795)
Balance Sheet Location
Fixed maturities, available-for-sale $ 728 $ 269 $ (39) $ (8) $ — $ — $ (39) $ (8)
Other investments 55,948 24,006 1,524 390 2,105 492 (581) (102)
Other liabilities 28,333 64,061 (654) (56) 387 1,612 (1,041) (1,668)
Consumer notes 39 64 (5) (5) — — (5) (5)
Reinsurance recoverables 8,767 10,301 280 347 280 347 — —
Other policyholder funds and benefits payable 43,039 47,613 (1,653) (2,010) 3 2 (1,656) (2,012)
Total derivatives $ 136,854 $ 146,314 $ (547) $ (1,342) $ 2,775 $ 2,453 $ (3,322) $ (3,795)
[1] The derivative instruments related to this strategy are held for other investment purposes.
[2] These derivatives are embedded within liabilities and are not held for risk management purposes.