The Hartford 2010 Annual Report Download - page 225
Download and view the complete annual report
Please find page 225 of the 2010 The Hartford annual report below. You can navigate through the pages in the report by either clicking on the pages listed below, or by using the keyword search tool below to find specific information within the annual report.-
 1
1 -
2
-
3
-
4
-
5
-
6
-
7
-
8
-
9
-
10
-
11
-
12
-
13
-
14
-
15
-
16
-
17
-
18
-
19
-
20
-
21
-
22
-
23
-
24
-
25
-
26
-
27
-
28
-
29
-
30
-
31
-
32
-
33
-
34
-
35
-
36
-
37
-
38
-
39
-
40
-
41
-
42
-
43
-
44
-
45
-
46
-
47
-
48
-
49
-
50
-
51
-
52
-
53
-
54
-
55
-
56
-
57
-
58
-
59
-
60
-
61
-
62
-
63
-
64
-
65
-
66
-
67
-
68
-
69
-
70
-
71
-
72
-
73
-
74
-
75
-
76
-
77
-
78
-
79
-
80
-
81
-
82
-
83
-
84
-
85
-
86
-
87
-
88
-
89
-
90
-
91
-
92
-
93
-
94
-
95
-
96
-
97
-
98
-
99
-
100
-
101
-
102
-
103
-
104
-
105
-
106
-
107
-
108
-
109
-
110
-
111
-
112
-
113
-
114
-
115
-
116
-
117
-
118
-
119
-
120
-
121
-
122
-
123
-
124
-
125
-
126
-
127
-
128
-
129
-
130
-
131
-
132
-
133
-
134
-
135
-
136
-
137
-
138
-
139
-
140
-
141
-
142
-
143
-
144
-
145
-
146
-
147
-
148
-
149
-
150
-
151
-
152
-
153
-
154
-
155
-
156
-
157
-
158
-
159
-
160
-
161
-
162
-
163
-
164
-
165
-
166
-
167
-
168
-
169
-
170
-
171
-
172
-
173
-
174
-
175
-
176
-
177
-
178
-
179
-
180
-
181
-
182
-
183
-
184
-
185
-
186
-
187
-
188
-
189
-
190
-
191
-
192
-
193
-
194
-
195
-
196
-
197
-
198
-
199
-
200
-
201
-
202
-
203
-
204
-
205
-
206
-
207
-
208
-
209
-
210
-
211
-
212
-
213
-
214
-
 215
215 -
 216
216 -
 217
217 -
 218
218 -
 219
219 -
 220
220 -
 221
221 -
 222
222 -
 223
223 -
 224
224 -
 225
225 -
 226
226 -
 227
227 -
 228
228 -
 229
229 -
 230
230 -
 231
231 -
 232
232 -
 233
233 -
 234
234 -
 235
235 -
236
-
237
-
238
-
239
-
240
-
241
-
242
-
243
-
244
-
245
-
246
-
247
-
248
 |
 |

S-1
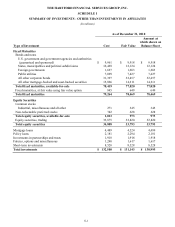
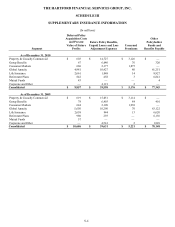
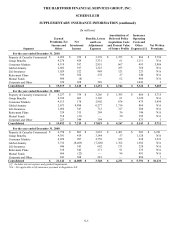
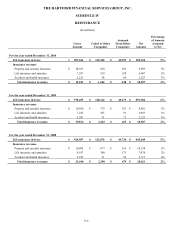
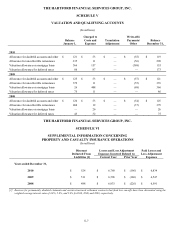
THE HARTFORD FINANCIAL SERVICES GROUP, INC.
SCHEDULE I
SUMMARY OF INVESTMENTS - OTHER THAN INVESTMENTS IN AFFILIATES
(In millions)
As of December 31, 2010
Type of Investment
Cost
Fair Value
Amount at
which shown on
Balance Sheet
Fixed Maturities
Bonds and notes
U.S. government and government agencies and authorities
(guaranteed and sponsored) $ 9,961 $ 9,918 $ 9,918
States, municipalities and political subdivisions 12,469 12,124 12,124
Foreign governments 1,627 1,683 1,683
Public utilities 7,099 7,427 7,427
All other corporate bonds 31,397 32,457 32,457
All other mortgage-backed and asset-backed securities 15,866 14,211 14,211
Total fixed maturities, available-for-sale 78,419 77,820 77,820
Fixed maturities, at fair value using fair value option 845 649 649
Total fixed maturities 79,264 78,469 78,469
Equity Securities
Common stocks
Industrial, miscellaneous and all other 271 345 345
Non-redeemable preferred stocks 742 628 628
Total equity securities, available-for-sale 1,013 973 973
Equity securities, trading 33,875 32,820 32,820
Total equity securities 34,888 33,793 33,793
Mortgage loans 4,489 4,524 4,489
Policy loans 2,181 2,294 2,181
Investments in partnerships and trusts 1,918 1,918 1,918
Futures, options and miscellaneous 1,240 1,617 1,617
Short-term investments 8,528 8,528 8,528
Total investments $ 132,508 $ 131,143 $ 130,995