The Hartford 2010 Annual Report Download - page 144
Download and view the complete annual report
Please find page 144 of the 2010 The Hartford annual report below. You can navigate through the pages in the report by either clicking on the pages listed below, or by using the keyword search tool below to find specific information within the annual report.-
 1
1 -
2
-
3
-
4
-
5
-
6
-
7
-
8
-
9
-
10
-
11
-
12
-
13
-
14
-
15
-
16
-
17
-
18
-
19
-
20
-
21
-
22
-
23
-
24
-
25
-
26
-
27
-
28
-
29
-
30
-
31
-
32
-
33
-
34
-
35
-
36
-
37
-
38
-
39
-
40
-
41
-
42
-
43
-
44
-
45
-
46
-
47
-
48
-
49
-
50
-
51
-
52
-
53
-
54
-
55
-
56
-
57
-
58
-
59
-
60
-
61
-
62
-
63
-
64
-
65
-
66
-
67
-
68
-
69
-
70
-
71
-
72
-
73
-
74
-
75
-
76
-
77
-
78
-
79
-
80
-
81
-
82
-
83
-
84
-
85
-
86
-
87
-
88
-
89
-
90
-
91
-
92
-
93
-
94
-
95
-
96
-
97
-
98
-
99
-
100
-
101
-
102
-
103
-
104
-
105
-
106
-
107
-
108
-
109
-
110
-
111
-
112
-
113
-
114
-
115
-
116
-
117
-
118
-
119
-
120
-
121
-
122
-
123
-
124
-
125
-
126
-
127
-
128
-
129
-
130
-
131
-
132
-
133
-
 134
134 -
 135
135 -
 136
136 -
 137
137 -
 138
138 -
 139
139 -
 140
140 -
 141
141 -
 142
142 -
 143
143 -
 144
144 -
 145
145 -
 146
146 -
 147
147 -
 148
148 -
 149
149 -
 150
150 -
 151
151 -
 152
152 -
 153
153 -
 154
154 -
155
-
156
-
157
-
158
-
159
-
160
-
161
-
162
-
163
-
164
-
165
-
166
-
167
-
168
-
169
-
170
-
171
-
172
-
173
-
174
-
175
-
176
-
177
-
178
-
179
-
180
-
181
-
182
-
183
-
184
-
185
-
186
-
187
-
188
-
189
-
190
-
191
-
192
-
193
-
194
-
195
-
196
-
197
-
198
-
199
-
200
-
201
-
202
-
203
-
204
-
205
-
206
-
207
-
208
-
209
-
210
-
211
-
212
-
213
-
214
-
215
-
216
-
217
-
218
-
219
-
220
-
221
-
222
-
223
-
224
-
225
-
226
-
227
-
228
-
229
-
230
-
231
-
232
-
233
-
234
-
235
-
236
-
237
-
238
-
239
-
240
-
241
-
242
-
243
-
244
-
245
-
246
-
247
-
248
 |
 |

THE HARTFORD FINANCIAL SERVICES GROUP, INC.
NOTES TO CONSOLIDATED FINANCIAL STATEMENTS (continued)
F-16
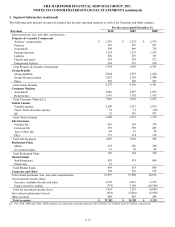
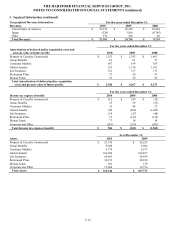
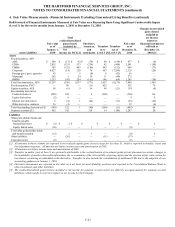
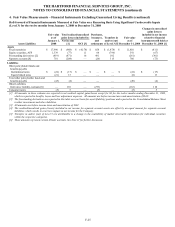
3. Segment Information (continued)
Geographical Revenue Information For the years ended December 31,
Revenues 2010 2009 2008
United States of America $ 22,376 $20,429 $18,904
Japan (329) 3,816 (9,745)
Other 336 456 60
Total Revenues $ 22,383 $24,701 $9,219
For the years ended December 31,
Amortization of deferred policy acquisition costs and
present value of future profits 2010 2009 2008
Property & Casualty Commercial $1,353 $1,393 $1,461
Group Benefits 61 61 57
Consumer Markets 667 674 633
Global Annuity 253 1,716 1,762
Life Insurance 121 317 171
Retirement Plans 27 56 91
Mutual Funds 62 50 96
Total Amortization of deferred policy acquisition
costs and present value of future profits $2,544 $4,267 $4,271
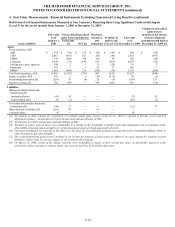
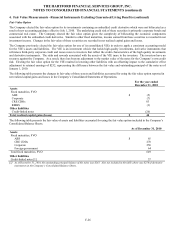
For the years ended December 31,
Income tax expense (benefit) 2010 2009 2008
Property & Casualty Commercial $412 $359 $(35)
Group Benefits 65 59 (53)
Consumer Markets 52 48 27
Global Annuity 109 (826) (1,425)
Life Insurance 119 (27) (40)
Retirement Plans 13 (143) (132)
Mutual Funds 77 18 19
Corporate and Other (263) (329) (203)
Total Income tax expense (benefit) $584 $(841) $(1,842)
As of December 31,
Assets 2010 2009
Property & Casualty Commercial $23,736 $ 24,225
Group Benefits 9,028 8,904
Consumer Markets 6,778 6,737
Global Annuity 166,684 164,837
Life Insurance 64,063 54,939
Retirement Plans 34,152 28,180
Mutual Funds 301 159
Corporate and Other 13,604 19,736
Total Assets $318,346 $307,717