The Hartford 2010 Annual Report Download - page 180
Download and view the complete annual report
Please find page 180 of the 2010 The Hartford annual report below. You can navigate through the pages in the report by either clicking on the pages listed below, or by using the keyword search tool below to find specific information within the annual report.-
 1
1 -
2
-
3
-
4
-
5
-
6
-
7
-
8
-
9
-
10
-
11
-
12
-
13
-
14
-
15
-
16
-
17
-
18
-
19
-
20
-
21
-
22
-
23
-
24
-
25
-
26
-
27
-
28
-
29
-
30
-
31
-
32
-
33
-
34
-
35
-
36
-
37
-
38
-
39
-
40
-
41
-
42
-
43
-
44
-
45
-
46
-
47
-
48
-
49
-
50
-
51
-
52
-
53
-
54
-
55
-
56
-
57
-
58
-
59
-
60
-
61
-
62
-
63
-
64
-
65
-
66
-
67
-
68
-
69
-
70
-
71
-
72
-
73
-
74
-
75
-
76
-
77
-
78
-
79
-
80
-
81
-
82
-
83
-
84
-
85
-
86
-
87
-
88
-
89
-
90
-
91
-
92
-
93
-
94
-
95
-
96
-
97
-
98
-
99
-
100
-
101
-
102
-
103
-
104
-
105
-
106
-
107
-
108
-
109
-
110
-
111
-
112
-
113
-
114
-
115
-
116
-
117
-
118
-
119
-
120
-
121
-
122
-
123
-
124
-
125
-
126
-
127
-
128
-
129
-
130
-
131
-
132
-
133
-
134
-
135
-
136
-
137
-
138
-
139
-
140
-
141
-
142
-
143
-
144
-
145
-
146
-
147
-
148
-
149
-
150
-
151
-
152
-
153
-
154
-
155
-
156
-
157
-
158
-
159
-
160
-
161
-
162
-
163
-
164
-
165
-
166
-
167
-
168
-
169
-
 170
170 -
 171
171 -
 172
172 -
 173
173 -
 174
174 -
 175
175 -
 176
176 -
 177
177 -
 178
178 -
 179
179 -
 180
180 -
 181
181 -
 182
182 -
 183
183 -
 184
184 -
 185
185 -
 186
186 -
 187
187 -
 188
188 -
 189
189 -
 190
190 -
191
-
192
-
193
-
194
-
195
-
196
-
197
-
198
-
199
-
200
-
201
-
202
-
203
-
204
-
205
-
206
-
207
-
208
-
209
-
210
-
211
-
212
-
213
-
214
-
215
-
216
-
217
-
218
-
219
-
220
-
221
-
222
-
223
-
224
-
225
-
226
-
227
-
228
-
229
-
230
-
231
-
232
-
233
-
234
-
235
-
236
-
237
-
238
-
239
-
240
-
241
-
242
-
243
-
244
-
245
-
246
-
247
-
248
 |
 |

THE HARTFORD FINANCIAL SERVICES GROUP, INC.
NOTES TO CONSOLIDATED FINANCIAL STATEMENTS (continued)
F-52
5. Investments and Derivative Instruments (continued)
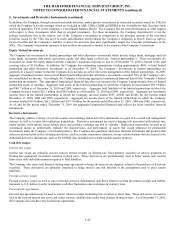
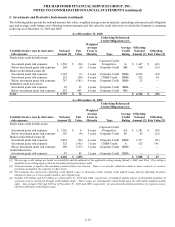
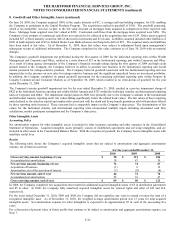
Non-qualifying Strategies
For non-qualifying strategies, including embedded derivatives that are required to be bifurcated from their host contracts and accounted
for as derivatives, the gain or loss on the derivative is recognized currently in earnings within net realized capital gains or losses. The
following table presents the gain or loss recognized in income on non-qualifying strategies:
Non-qualifying Strategies
Gain (Loss) Recognized within Net Realized Capital Gains (Losses)
December 31,
2010 2009 2008
Interest rate contracts
Interest rate swaps, caps, floors, and forwards $ 45 $ 31 $ 12
Foreign exchange contracts
Foreign currency swaps and forwards (1) (49) 47
Japan 3Win foreign currency swaps [1] 215 (22) —
Japanese fixed annuity hedging instruments [2] 385 (12) 487
Japanese variable annuity hedging instruments 102 (17) 40
Credit contracts
Credit derivatives that purchase credit protection (23) (533) 302
Credit derivatives that assume credit risk 196 167 (623)
Equity contracts
Equity index swaps and options 5 (3) (25)
Warrants — 70 110
Variable annuity hedge program
GMWB product derivatives 508 4,748 (5,786)
GMWB reinsurance contracts (102) (988) 1,073
GMWB hedging instruments (295) (2,234) 3,374
Macro hedge program (562) (895) 74
Other
GMAB product derivatives 4 5 2
Contingent capital facility put option (6) (8) (3)
Total $ 471 $ 260 $ (916)
[1] The associated liability is adjusted for changes in spot rates through realized capital gains and losses and was $(273) and $64 for the years ended
December 31, 2010 and 2009, respectively. There were no Japan 3Win foreign currency swaps as of December 31, 2008.
[2] The associated liability is adjusted for changes in spot rates through realized capital gains and losses and was $(332), $67, and $450 for the years
ended December 31, 2010, 2009 and 2008, respectively. In addition, included are gains of $1 for the year ended December 31, 2010 related to
Japan FVO fixed maturity securities. There were no Japan FVO fixed maturity securities as of December 31, 2009 and December 31, 2008.
For the year ended December 31, 2010, the net realized capital gain (loss) related to derivatives used in non-qualifying strategies was
primarily comprised of the following:
• The net loss associated with the macro hedge program is primarily due to a higher equity market valuation, time decay, and lower
implied market volatility, partially offset by gains due to the strengthening of the Japanese yen.
• The net gain on the Japanese fixed annuity hedging instruments is primarily due to the strengthening of the Japanese yen in
comparison to the U.S. dollar.
• The net gain related to the Japan 3Win foreign currency swaps is primarily due to the strengthening of the Japanese yen in
comparison to the U.S. dollar, partially offset by the decrease in long-term U.S. interest rates.
• The net gain associated with credit derivatives that assume credit risk is primarily due to credit spreads tightening.
• The gain related to the combined GMWB hedging program, which includes the GMWB product, reinsurance, and hedging
derivatives, was primarily a result of liability model assumption updates during third quarter, lower implied market volatility, and
outperformance of the underlying actively managed funds as compared to their respective indices, partially offset by a general
decrease in long-term interest rates and rising equity markets.