The Hartford 2010 Annual Report Download - page 157
Download and view the complete annual report
Please find page 157 of the 2010 The Hartford annual report below. You can navigate through the pages in the report by either clicking on the pages listed below, or by using the keyword search tool below to find specific information within the annual report.-
 1
1 -
2
-
3
-
4
-
5
-
6
-
7
-
8
-
9
-
10
-
11
-
12
-
13
-
14
-
15
-
16
-
17
-
18
-
19
-
20
-
21
-
22
-
23
-
24
-
25
-
26
-
27
-
28
-
29
-
30
-
31
-
32
-
33
-
34
-
35
-
36
-
37
-
38
-
39
-
40
-
41
-
42
-
43
-
44
-
45
-
46
-
47
-
48
-
49
-
50
-
51
-
52
-
53
-
54
-
55
-
56
-
57
-
58
-
59
-
60
-
61
-
62
-
63
-
64
-
65
-
66
-
67
-
68
-
69
-
70
-
71
-
72
-
73
-
74
-
75
-
76
-
77
-
78
-
79
-
80
-
81
-
82
-
83
-
84
-
85
-
86
-
87
-
88
-
89
-
90
-
91
-
92
-
93
-
94
-
95
-
96
-
97
-
98
-
99
-
100
-
101
-
102
-
103
-
104
-
105
-
106
-
107
-
108
-
109
-
110
-
111
-
112
-
113
-
114
-
115
-
116
-
117
-
118
-
119
-
120
-
121
-
122
-
123
-
124
-
125
-
126
-
127
-
128
-
129
-
130
-
131
-
132
-
133
-
134
-
135
-
136
-
137
-
138
-
139
-
140
-
141
-
142
-
143
-
144
-
145
-
146
-
 147
147 -
 148
148 -
 149
149 -
 150
150 -
 151
151 -
 152
152 -
 153
153 -
 154
154 -
 155
155 -
 156
156 -
 157
157 -
 158
158 -
 159
159 -
 160
160 -
 161
161 -
 162
162 -
 163
163 -
 164
164 -
 165
165 -
 166
166 -
 167
167 -
168
-
169
-
170
-
171
-
172
-
173
-
174
-
175
-
176
-
177
-
178
-
179
-
180
-
181
-
182
-
183
-
184
-
185
-
186
-
187
-
188
-
189
-
190
-
191
-
192
-
193
-
194
-
195
-
196
-
197
-
198
-
199
-
200
-
201
-
202
-
203
-
204
-
205
-
206
-
207
-
208
-
209
-
210
-
211
-
212
-
213
-
214
-
215
-
216
-
217
-
218
-
219
-
220
-
221
-
222
-
223
-
224
-
225
-
226
-
227
-
228
-
229
-
230
-
231
-
232
-
233
-
234
-
235
-
236
-
237
-
238
-
239
-
240
-
241
-
242
-
243
-
244
-
245
-
246
-
247
-
248
 |
 |
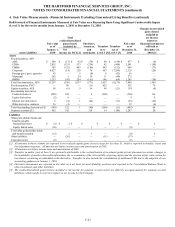
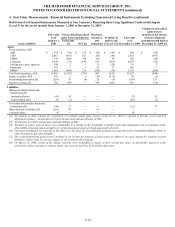
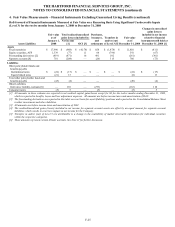
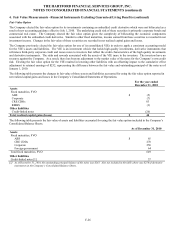
THE HARTFORD FINANCIAL SERVICES GROUP, INC.
NOTES TO CONSOLIDATED FINANCIAL STATEMENTS (continued)
F-29
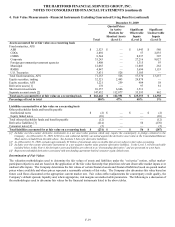
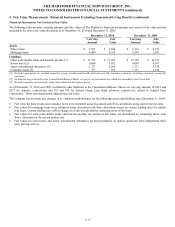
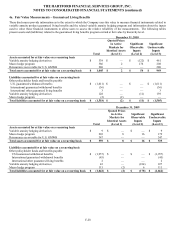
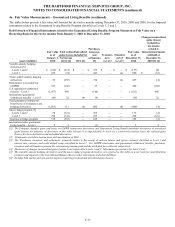
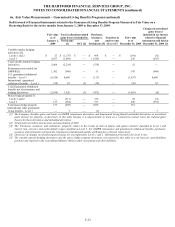
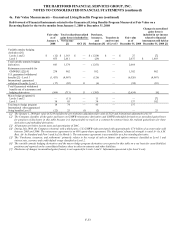
4a. Fair Value Measurements – Guaranteed Living Benefits (continued)
Product Derivatives
The Company currently offers certain variable annuity products with GMWB riders in the U.S., and formerly offered such products in
the U.K. and Japan. The GMWB represents an embedded derivative in the variable annuity contract. When it is determined that (1) the
embedded derivative possesses economic characteristics that are not clearly and closely related to the economic characteristics of the
host contract, and (2) a separate instrument with the same terms would qualify as a derivative instrument, the embedded derivative is
bifurcated from the host for measurement purposes. The embedded derivative is carried at fair value, with changes in fair value
reported in net realized capital gains and losses. The Company's GMWB liability is reported in other policyholder funds and benefits
payable in the Consolidated Balance Sheets.
In valuing the embedded derivative, the Company attributes to the derivative a portion of the expected fees to be collected over the
expected life of the contract from the contract holder equal to the present value of future GMWB claims (the “Attributed Fees”). The
excess of fees collected from the contract holder in the current period over the current period’ s Attributed Fees are associated with the
host variable annuity contract and reported in fee income.
U.S. GMWB Reinsurance Derivative
The Company has reinsurance arrangements in place to transfer a portion of its risk of loss due to GMWB. These arrangements are
recognized as derivatives and carried at fair value in reinsurance recoverables. Changes in the fair value of the reinsurance agreements
are reported in net realized capital gains and losses.
The fair value of the U.S. GMWB reinsurance derivative is calculated as an aggregation of the components described in the Living
Benefits Required to be Fair Valued discussion below and is modeled using significant unobservable policyholder behavior inputs,
identical to those used in calculating the underlying liability, such as lapses, fund selection, resets and withdrawal utilization and risk
margins.
Living Benefits Required to be Fair Valued (in Other Policyholder Funds and Benefits Payable)
Fair values for GMWB and guaranteed minimum accumulation benefit (“GMAB”) contracts are calculated using the income approach
based upon internally developed models because active, observable markets do not exist for those items. The fair value of the
Company’ s guaranteed benefit liabilities, classified as embedded derivatives, and the related reinsurance and customized freestanding
derivatives is calculated as an aggregation of the following components: Best Estimate Claim Payments; Credit Standing Adjustment;
and Margins. The resulting aggregation is reconciled or calibrated, if necessary, to market information that is, or may be, available to
the Company, but may not be observable by other market participants, including reinsurance discussions and transactions. The
Company believes the aggregation of these components, as necessary and as reconciled or calibrated to the market information available
to the Company, results in an amount that the Company would be required to transfer or receive, for an asset, to or from market
participants in an active liquid market, if one existed, for those market participants to assume the risks associated with the guaranteed
minimum benefits and the related reinsurance and customized derivatives. The fair value is likely to materially diverge from the
ultimate settlement of the liability as the Company believes settlement will be based on our best estimate assumptions rather than those
best estimate assumptions plus risk margins. In the absence of any transfer of the guaranteed benefit liability to a third party, the release
of risk margins is likely to be reflected as realized gains in future periods’ net income. Each component described below is
unobservable in the marketplace and require subjectivity by the Company in determining their value.
Best Estimate
Claim Payments
The Best Estimate Claim Payments is calculated based on actuarial and capital market assumptions related to projected cash flows,
including the present value of benefits and related contract charges, over the lives of the contracts, incorporating expectations
concerning policyholder behavior such as lapses, fund selection, resets and withdrawal utilization. For the customized derivatives,
policyholder behavior is prescribed in the derivative contract. Because of the dynamic and complex nature of these cash flows, best
estimate assumptions and a Monte Carlo stochastic process is used in valuation. The Monte Carlo stochastic process involves the
generation of thousands of scenarios that assume risk neutral returns consistent with swap rates and a blend of observable implied index
volatility levels. Estimating these cash flows involves numerous estimates and subjective judgments regarding a number of variables –
including expected market rates of return, market volatility, correlations of market index returns to funds, fund performance, discount
rates and assumptions about policyholder behavior which emerge over time.
At each valuation date, the Company assumes expected returns based on:
• risk-free rates as represented by the eurodollar futures, LIBOR deposits and swap rates to derive forward curve rates;
• market implied volatility assumptions for each underlying index based primarily on a blend of observed market “implied volatility”
data;
• correlations of historical returns across underlying well known market indices based on actual observed returns over the ten years
preceding the valuation date; and
• three years of history for fund indexes compared to separate account fund regression.