The Hartford 2010 Annual Report Download - page 29
Download and view the complete annual report
Please find page 29 of the 2010 The Hartford annual report below. You can navigate through the pages in the report by either clicking on the pages listed below, or by using the keyword search tool below to find specific information within the annual report.-
 1
1 -
2
-
3
-
4
-
5
-
6
-
7
-
8
-
9
-
10
-
11
-
12
-
13
-
14
-
15
-
16
-
17
-
18
-
 19
19 -
 20
20 -
 21
21 -
 22
22 -
 23
23 -
 24
24 -
 25
25 -
 26
26 -
 27
27 -
 28
28 -
 29
29 -
 30
30 -
 31
31 -
 32
32 -
 33
33 -
 34
34 -
 35
35 -
 36
36 -
 37
37 -
 38
38 -
 39
39 -
40
-
41
-
42
-
43
-
44
-
45
-
46
-
47
-
48
-
49
-
50
-
51
-
52
-
53
-
54
-
55
-
56
-
57
-
58
-
59
-
60
-
61
-
62
-
63
-
64
-
65
-
66
-
67
-
68
-
69
-
70
-
71
-
72
-
73
-
74
-
75
-
76
-
77
-
78
-
79
-
80
-
81
-
82
-
83
-
84
-
85
-
86
-
87
-
88
-
89
-
90
-
91
-
92
-
93
-
94
-
95
-
96
-
97
-
98
-
99
-
100
-
101
-
102
-
103
-
104
-
105
-
106
-
107
-
108
-
109
-
110
-
111
-
112
-
113
-
114
-
115
-
116
-
117
-
118
-
119
-
120
-
121
-
122
-
123
-
124
-
125
-
126
-
127
-
128
-
129
-
130
-
131
-
132
-
133
-
134
-
135
-
136
-
137
-
138
-
139
-
140
-
141
-
142
-
143
-
144
-
145
-
146
-
147
-
148
-
149
-
150
-
151
-
152
-
153
-
154
-
155
-
156
-
157
-
158
-
159
-
160
-
161
-
162
-
163
-
164
-
165
-
166
-
167
-
168
-
169
-
170
-
171
-
172
-
173
-
174
-
175
-
176
-
177
-
178
-
179
-
180
-
181
-
182
-
183
-
184
-
185
-
186
-
187
-
188
-
189
-
190
-
191
-
192
-
193
-
194
-
195
-
196
-
197
-
198
-
199
-
200
-
201
-
202
-
203
-
204
-
205
-
206
-
207
-
208
-
209
-
210
-
211
-
212
-
213
-
214
-
215
-
216
-
217
-
218
-
219
-
220
-
221
-
222
-
223
-
224
-
225
-
226
-
227
-
228
-
229
-
230
-
231
-
232
-
233
-
234
-
235
-
236
-
237
-
238
-
239
-
240
-
241
-
242
-
243
-
244
-
245
-
246
-
247
-
248
 |
 |

29
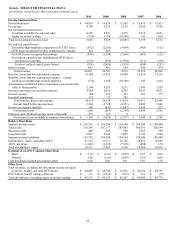
Item 6. SELECTED FINANCIAL DATA
(In millions, except for per share data and combined ratios)
2010 2009 2008 2007 2006
Income Statement Data
Earned premiums $14,055 $14,424 $15,503 $ 15,619 $15,023
Fee income 4,784 4,576 5,135 5,436 4,739
Net investment income (loss):
Securities available-for-sale and other 4,392 4,031 4,335 5,214 4,691
Equity securities, trading (774) 3,188 (10,340) 145 1,824
Total net investment income (loss) 3,618 7,219 (6,005) 5,359 6,515
Net realized capital losses:
Total other-than-temporary impairment ("OTTI") losses (852) (2,191) (3,964) (483) (121)
OTTI losses recognized in other comprehensive income 418 683 — — —
Net OTTI losses recognized in earnings (434) (1,508) (3,964) (483) (121)
Net realized capital losses, excluding net OTTI losses
recognized in earnings
(120) (502) (1,954) (511) (130)
Total net realized capital gains (losses) (554) (2,010) (5,918) (994) (251)
Other revenues 480 492 504 496 474
Total revenues 22,383 24,701 9,219 25,916 26,500
Benefits, losses and loss adjustment expenses 13,025 13,831 14,088 13,919 13,218
Benefits, losses and loss adjustment expenses – returns
credited on international variable annuities (774) 3,188 (10,340) 145 1,824
Amortization of deferred policy acquisition costs and present
value of future profits 2,544 4,267 4,271 2,989 3,558
Insurance operating costs and other expenses 4,663 4,635 4,703 4,595 4,021
Interest expense 508 476 343 263 277
Goodwill impairment 153 32 745 — —
Total benefits, losses and expenses 20,119 26,429 13,810 21,911 22,898
Income (loss) before income taxes 2,264 (1,728) (4,591) 4,005 3,602
Income tax expense (benefit) 584 (841) (1,842) 1,056 857
Net income (loss) 1,680 (887) (2,749) 2,949 2,745
Preferred stock dividends and accretion of discount 515 127 8 — —
Net income (loss) available to common shareholders $1,165 $(1,014) $(2,757) $ 2,949 $2,745
Balance Sheet Data
Separate account assets $159,742 $150,394 $130,184 $ 199,946 $180,484
Total assets 318,346 307,717 287,583 360,361 326,544
Short-term debt 400 343 398 1,365 599
Long-term debt 6,207 5,496 5,823 3,142 3,504
Separate account liabilities 159,742 150,394 130,184 199,946 180,484
Stockholders’ equity, excluding AOCI 21,312 21,177 16,788 20,062 18,698
AOCI, net of tax (1,001) (3,312) (7,520) (858) 178
Total stockholders’ equity 20,311 17,865 9,268 19,204 18,876
Earnings (Loss) Per Common Share Data
Basic $2.70 $(2.93) $(8.99) $ 9.32 $8.89
Diluted 2.49 (2.93) (8.99) 9.24 8.69
Cash dividends declared per common share 0.20 0.20 1.91 2.03 1.70
Other Data
Total revenues, excluding net investment income on equity
securities, trading, and total OTTI losses $ 24,009 $ 23,704 $ 23,523 $ 26,254 $ 24,797
DAC Unlock benefit (charge), after-tax $ 111 $ (1,034) $ (932) $ 213 $ (76)
Total investments, excluding equity securities, trading $ 98,175 $ 93,235 $ 89,287 $ 94,904 $ 89,778