The Hartford 2010 Annual Report Download - page 170
Download and view the complete annual report
Please find page 170 of the 2010 The Hartford annual report below. You can navigate through the pages in the report by either clicking on the pages listed below, or by using the keyword search tool below to find specific information within the annual report.-
 1
1 -
2
-
3
-
4
-
5
-
6
-
7
-
8
-
9
-
10
-
11
-
12
-
13
-
14
-
15
-
16
-
17
-
18
-
19
-
20
-
21
-
22
-
23
-
24
-
25
-
26
-
27
-
28
-
29
-
30
-
31
-
32
-
33
-
34
-
35
-
36
-
37
-
38
-
39
-
40
-
41
-
42
-
43
-
44
-
45
-
46
-
47
-
48
-
49
-
50
-
51
-
52
-
53
-
54
-
55
-
56
-
57
-
58
-
59
-
60
-
61
-
62
-
63
-
64
-
65
-
66
-
67
-
68
-
69
-
70
-
71
-
72
-
73
-
74
-
75
-
76
-
77
-
78
-
79
-
80
-
81
-
82
-
83
-
84
-
85
-
86
-
87
-
88
-
89
-
90
-
91
-
92
-
93
-
94
-
95
-
96
-
97
-
98
-
99
-
100
-
101
-
102
-
103
-
104
-
105
-
106
-
107
-
108
-
109
-
110
-
111
-
112
-
113
-
114
-
115
-
116
-
117
-
118
-
119
-
120
-
121
-
122
-
123
-
124
-
125
-
126
-
127
-
128
-
129
-
130
-
131
-
132
-
133
-
134
-
135
-
136
-
137
-
138
-
139
-
140
-
141
-
142
-
143
-
144
-
145
-
146
-
147
-
148
-
149
-
150
-
151
-
152
-
153
-
154
-
155
-
156
-
157
-
158
-
159
-
 160
160 -
 161
161 -
 162
162 -
 163
163 -
 164
164 -
 165
165 -
 166
166 -
 167
167 -
 168
168 -
 169
169 -
 170
170 -
 171
171 -
 172
172 -
 173
173 -
 174
174 -
 175
175 -
 176
176 -
 177
177 -
 178
178 -
 179
179 -
 180
180 -
181
-
182
-
183
-
184
-
185
-
186
-
187
-
188
-
189
-
190
-
191
-
192
-
193
-
194
-
195
-
196
-
197
-
198
-
199
-
200
-
201
-
202
-
203
-
204
-
205
-
206
-
207
-
208
-
209
-
210
-
211
-
212
-
213
-
214
-
215
-
216
-
217
-
218
-
219
-
220
-
221
-
222
-
223
-
224
-
225
-
226
-
227
-
228
-
229
-
230
-
231
-
232
-
233
-
234
-
235
-
236
-
237
-
238
-
239
-
240
-
241
-
242
-
243
-
244
-
245
-
246
-
247
-
248
 |
 |

THE HARTFORD FINANCIAL SERVICES GROUP, INC.
NOTES TO CONSOLIDATED FINANCIAL STATEMENTS (continued)
F-42
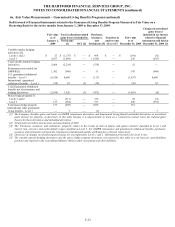
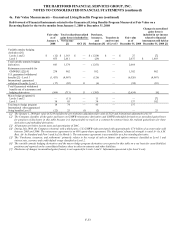
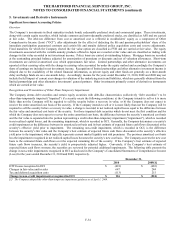
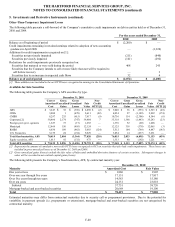
5. Investments and Derivative Instruments (continued)
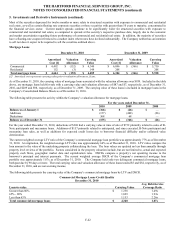
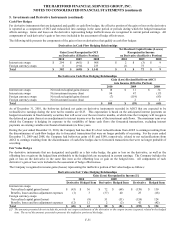
Most of the securities depressed for twelve months or more relate to structured securities with exposure to commercial and residential
real estate, as well as certain floating rate corporate securities or those securities with greater than 10 years to maturity, concentrated in
the financial services sector. Current market spreads continue to be significantly wider for structured securities with exposure to
commercial and residential real estate, as compared to spreads at the security’ s respective purchase date, largely due to the economic
and market uncertainties regarding future performance of commercial and residential real estate. In addition, the majority of securities
have a floating-rate coupon referenced to a market index where rates have declined substantially. The Company neither has an intention
to sell nor does it expect to be required to sell the securities outlined above.
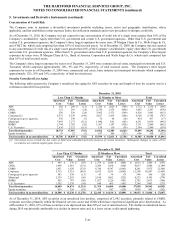
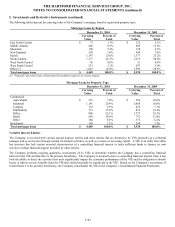
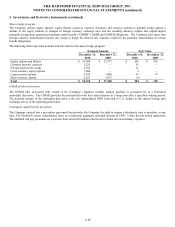
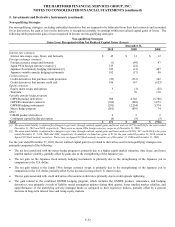
Mortgage Loans
December 31, 2010 December 31, 2009
Amortized
Cost [1]
Valuation
Allowance
Carrying
Value
Amortized
Cost [1]
Valuation
Allowance
Carrying
Value
Commercial $ 4,492 $ (152) $ 4,340 $ 6,096 $ (366) $ 5,730
Residential 152 (3) 149 208 — 208
Total mortgage loans $ 4,644 $ (155) $ 4,489 $ 6,304 $ (366) $ 5,938
[1] Amortized cost represents carrying value prior to valuation allowances, if any.
As of December 31, 2010, the carrying value of mortgage loans associated with the valuation allowance was $959. Included in the table
above, are mortgage loans held-for-sale with a carrying value and valuation allowance of $87 and $7, respectively, as of December 31,
2010, and $209 and $98, respectively, as of December 31, 2009. The carrying value of these loans is included in mortgage loans in the
Company’ s Consolidated Balance Sheets as of December 31, 2010.
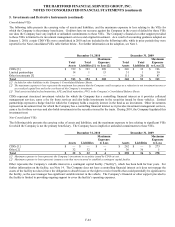
The following table presents the activity within the Company’ s valuation allowance for mortgage loans.
For the years ended December 31,
2010 2009 2008
Balance as of January 1 $ (366) $ (26) $ —
Additions (157) (408) (26)
Deductions 368 68 —
Balance as of December 31 $ (155) $ (366) $ (26)
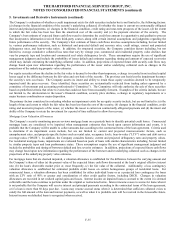
For the year ended December 31, 2010, deductions of $368 had a carrying value at time of sale of $732 primarily related to sales of B-
Note participants and mezzanine loans. Additions of $157 primarily related to anticipated, and since executed, B-Note participant and
mezzanine loan sales, as well as additions for expected credit losses due to borrower financial difficulty and/or collateral value
deterioration.
The current weighted average LTV ratio of the Company’ s commercial mortgage loan portfolio was approximately 77% as of December
31, 2010. At origination, the weighted-average LTV ratio was approximately 64% as of December 31, 2010. LTV ratios compare the
loan amount to the value of the underlying property collateralizing the loan. The loan values are updated no less than annually through
property level reviews of the portfolio. Factors considered in the property valuation include, but are not limited to, actual and expected
property cash flows, geographic market data and capitalization rates. DSCRs compare a property’ s net operating income to the
borrower’ s principal and interest payments. The current weighted average DSCR of the Company’ s commercial mortgage loan
portfolio was approximately 1.87x as of December 31, 2010. The Company held only two delinquent commercial mortgage loans,
both past due by 90 days or more. The total carrying value and valuation allowance of these loans totaled $5 and $54, respectively, as of
December 31, 2010, and are not accruing income.
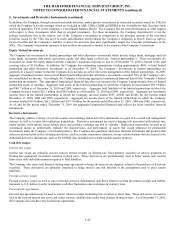
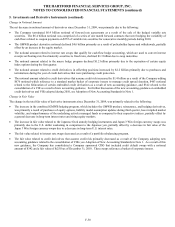
The following table presents the carrying value of the Company’ s commercial mortgage loans by LTV and DSCR.
Commercial Mortgage Loans Credit Quality
December 31, 2010
Loan-to-value Carrying Value
Avg. Debt-Service
Coverage Ratio
Greater than 80% $1,358 1.49x
65% - 80% 1,829 1.93x
Less than 65% 1,153 2.26x
Total commercial mortgage loans $4,340 1.87x