The Hartford 2010 Annual Report Download - page 117
Download and view the complete annual report
Please find page 117 of the 2010 The Hartford annual report below. You can navigate through the pages in the report by either clicking on the pages listed below, or by using the keyword search tool below to find specific information within the annual report.-
 1
1 -
2
-
3
-
4
-
5
-
6
-
7
-
8
-
9
-
10
-
11
-
12
-
13
-
14
-
15
-
16
-
17
-
18
-
19
-
20
-
21
-
22
-
23
-
24
-
25
-
26
-
27
-
28
-
29
-
30
-
31
-
32
-
33
-
34
-
35
-
36
-
37
-
38
-
39
-
40
-
41
-
42
-
43
-
44
-
45
-
46
-
47
-
48
-
49
-
50
-
51
-
52
-
53
-
54
-
55
-
56
-
57
-
58
-
59
-
60
-
61
-
62
-
63
-
64
-
65
-
66
-
67
-
68
-
69
-
70
-
71
-
72
-
73
-
74
-
75
-
76
-
77
-
78
-
79
-
80
-
81
-
82
-
83
-
84
-
85
-
86
-
87
-
88
-
89
-
90
-
91
-
92
-
93
-
94
-
95
-
96
-
97
-
98
-
99
-
100
-
101
-
102
-
103
-
104
-
105
-
106
-
 107
107 -
 108
108 -
 109
109 -
 110
110 -
 111
111 -
 112
112 -
 113
113 -
 114
114 -
 115
115 -
 116
116 -
 117
117 -
 118
118 -
 119
119 -
 120
120 -
 121
121 -
 122
122 -
 123
123 -
 124
124 -
 125
125 -
 126
126 -
 127
127 -
128
-
129
-
130
-
131
-
132
-
133
-
134
-
135
-
136
-
137
-
138
-
139
-
140
-
141
-
142
-
143
-
144
-
145
-
146
-
147
-
148
-
149
-
150
-
151
-
152
-
153
-
154
-
155
-
156
-
157
-
158
-
159
-
160
-
161
-
162
-
163
-
164
-
165
-
166
-
167
-
168
-
169
-
170
-
171
-
172
-
173
-
174
-
175
-
176
-
177
-
178
-
179
-
180
-
181
-
182
-
183
-
184
-
185
-
186
-
187
-
188
-
189
-
190
-
191
-
192
-
193
-
194
-
195
-
196
-
197
-
198
-
199
-
200
-
201
-
202
-
203
-
204
-
205
-
206
-
207
-
208
-
209
-
210
-
211
-
212
-
213
-
214
-
215
-
216
-
217
-
218
-
219
-
220
-
221
-
222
-
223
-
224
-
225
-
226
-
227
-
228
-
229
-
230
-
231
-
232
-
233
-
234
-
235
-
236
-
237
-
238
-
239
-
240
-
241
-
242
-
243
-
244
-
245
-
246
-
247
-
248
 |
 |

117
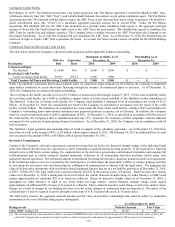
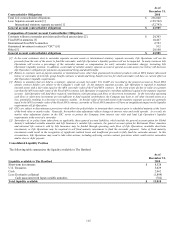
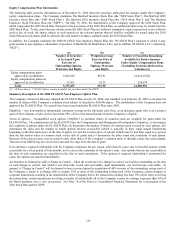
Capitalization
The capital structure of The Hartford as of December 31, 2010 and December 31, 2009 consisted of debt and stockholders’ equity,
summarized as follows:
December 31, December 31,
2010 2009 Change
Short-term debt (includes current maturities of long-term debt and capital lease obligations) $ 400 $ 343 17%
Long-term debt 6,207 5,496 13%
Total debt [1] 6,607 5,839 13%
Stockholders’ equity excluding accumulated other comprehensive loss, net of tax (“AOCI”) 21,312 21,177 1%
AOCI, net of tax (1,001) (3,312) 70%
Total stockholders' equity $ 20,311 $ 17,865 14%
Total capitalization including AOCI $ 26,918 $ 23,704 14%
Debt to stockholders’ equity 33% 33%
Debt to capitalization 25% 25%
[1] Total debt of the Company excludes $382 and $1.1 billion of consumer notes as of December 31, 2010 and December 31, 2009, respectively, and
$25 and $78 of Federal Home Loan Bank advances recorded in other liabilities as of December 31, 2010 and December 31, 2009, respectively.
The Hartford’ s total capitalization increased $3.2 billion, or 14%, from December 31, 2009 to December 31, 2010 due to increases in
debt, improvements in AOCI and increases in stockholders’ equity, excluding AOCI.
Total debt increased primarily due to the issuance of $1.1 billion in senior notes in March 2010 partially offset by the repayment of $275
in senior notes in June 2010 and payment of capital lease obligations in January 2010.
AOCI, net of tax, improved primarily due to increases in net unrealized available-for-sale securities of $2.0 billion primarily as a result
of improved security valuations due to declining interest rates and an increase of $128 in cash flow hedging instruments.
The increase in stockholders’ equity, excluding AOCI, was primarily due to net income available to common shareholders of $1.2
billion, issuance of common shares under public offering of $1.6 billion, and issuance of mandatory convertible preferred stock of $556,
partially offset by the redemption of $3.4 billion in preferred stock issued to the U.S. Treasury. See Note 15 of the Notes to
Consolidated Financial Statements for additional information on the redemption of the preferred stock and issuances of stock in 2010.
For additional information on stockholders’ equity, AOCI, net of tax, pension and other postretirement plans and Allianz’ s investment in
The Hartford see Notes 15, 16, 17 and 21, respectively, of the Notes to Consolidated Financial Statements.
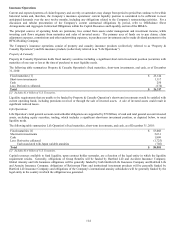
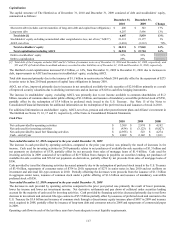
Cash Flow
2010 2009 2008
Net cash provided by operating activities $3,309 $ 2,974 $4,192
Net cash used for investing activities $(434) $ (3,123) $(8,827)
Net cash provided by (used for) financing activities $(2,955) $ 523 $4,274
Cash – end of year $2,062 $ 2,142 $1,811
Year ended December 31, 2010 compared to the year ended December 31, 2009
The increase in cash provided by operating activities, compared to the prior year period, was primarily the result of increases in fee
income. Cash used for investing activities in 2010 primarily relates to net purchases of available-for-sale securities of $1.5 billion and
net payments on derivatives of $338, partially offset by net proceeds from sales of mortgage loans of $1.4 billion. Cash used for
investing activities in 2009 consisted of net outflows of $2.9 billion from changes in payables on securities lending, net purchases of
available-for-sale securities and $561of net payments on derivatives, partially offset by net proceeds from sales of mortgage loans of
$396.
Cash provided by (used for) financing activities decreased primarily due to the redemption of preferred stock issued to the U.S. Treasury
of $3.4 billion, repayments of consumer notes of $754 in 2010, repayment of $275 in senior notes in June 2010 and net outflows on
investment and universal life-type contracts in 2010. Partially offsetting the decreases were proceeds from the issuance of $1.1 billion
in aggregate senior notes, issuance of common stock under a public offering of $1.6 billion and issuance of mandatory convertible
preferred stock of $556.
Year ended December 31, 2009 compared to the year ended December 31, 2008
The decrease in cash provided by operating activities compared to the prior year period was primarily the result of lower premiums,
lower fee income and lower net investment income. Net derivative settlements and pay down of collateral under securities lending
account for the majority of cash used for investing activities. Cash provided by financing activities decreased primarily due to net flows
decrease in investment and universal life-type contracts of $5.5 billion partially offset by issuances of preferred stock and warrants to the
U.S. Treasury for $3.4 billion and issuance of common stock through a discretionary equity issuance plan of $887 in 2009 and treasury
stock acquired in 2008, partially offset by issuance of long-term debt and consumer notes in 2008 and repayments of commercial paper
in 2009.
Operating cash flows in each of the last three years have been adequate to meet liquidity requirements.