The Hartford 2010 Annual Report Download - page 107
Download and view the complete annual report
Please find page 107 of the 2010 The Hartford annual report below. You can navigate through the pages in the report by either clicking on the pages listed below, or by using the keyword search tool below to find specific information within the annual report.-
 1
1 -
2
-
3
-
4
-
5
-
6
-
7
-
8
-
9
-
10
-
11
-
12
-
13
-
14
-
15
-
16
-
17
-
18
-
19
-
20
-
21
-
22
-
23
-
24
-
25
-
26
-
27
-
28
-
29
-
30
-
31
-
32
-
33
-
34
-
35
-
36
-
37
-
38
-
39
-
40
-
41
-
42
-
43
-
44
-
45
-
46
-
47
-
48
-
49
-
50
-
51
-
52
-
53
-
54
-
55
-
56
-
57
-
58
-
59
-
60
-
61
-
62
-
63
-
64
-
65
-
66
-
67
-
68
-
69
-
70
-
71
-
72
-
73
-
74
-
75
-
76
-
77
-
78
-
79
-
80
-
81
-
82
-
83
-
84
-
85
-
86
-
87
-
88
-
89
-
90
-
91
-
92
-
93
-
94
-
95
-
96
-
 97
97 -
 98
98 -
 99
99 -
 100
100 -
 101
101 -
 102
102 -
 103
103 -
 104
104 -
 105
105 -
 106
106 -
 107
107 -
 108
108 -
 109
109 -
 110
110 -
 111
111 -
 112
112 -
 113
113 -
 114
114 -
 115
115 -
 116
116 -
 117
117 -
118
-
119
-
120
-
121
-
122
-
123
-
124
-
125
-
126
-
127
-
128
-
129
-
130
-
131
-
132
-
133
-
134
-
135
-
136
-
137
-
138
-
139
-
140
-
141
-
142
-
143
-
144
-
145
-
146
-
147
-
148
-
149
-
150
-
151
-
152
-
153
-
154
-
155
-
156
-
157
-
158
-
159
-
160
-
161
-
162
-
163
-
164
-
165
-
166
-
167
-
168
-
169
-
170
-
171
-
172
-
173
-
174
-
175
-
176
-
177
-
178
-
179
-
180
-
181
-
182
-
183
-
184
-
185
-
186
-
187
-
188
-
189
-
190
-
191
-
192
-
193
-
194
-
195
-
196
-
197
-
198
-
199
-
200
-
201
-
202
-
203
-
204
-
205
-
206
-
207
-
208
-
209
-
210
-
211
-
212
-
213
-
214
-
215
-
216
-
217
-
218
-
219
-
220
-
221
-
222
-
223
-
224
-
225
-
226
-
227
-
228
-
229
-
230
-
231
-
232
-
233
-
234
-
235
-
236
-
237
-
238
-
239
-
240
-
241
-
242
-
243
-
244
-
245
-
246
-
247
-
248
 |
 |

107
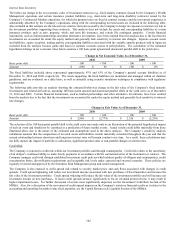
Macro Hedging
The Company’ s macro hedging program uses derivative instruments such as options, futures, swaps, and forwards on equities, interest
rates, and currencies to provide protection against the statutory tail scenario risk arising from U.S., U.K. and Japan GMWB, GMDB,
GMIB and GMAB liabilities, on the Company’ s statutory surplus and the associated target RBC ratios (see Capital Resources and
Liquidity). These macro hedges cover some of the residual risks not otherwise covered by specific dynamic hedging programs.
Management assesses this residual risk under various scenarios in designing and executing the macro hedge program. During the year,
the Company increased its equity macro hedge coverage including currency protection. The macro hedge program will result in
additional U.S. GAAP earnings volatility as changes in the value of the macro hedge derivatives, which are designed to reduce statutory
reserve and capital volatility, may not be closely aligned to changes in U.S. GAAP liabilities.
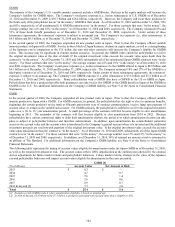
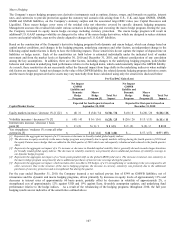
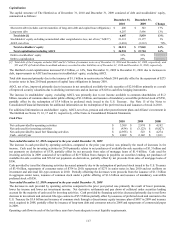
Based on the construction of the Company’ s derivative hedging program (both dynamic and macro hedge), which can change based on
capital market conditions, and changes in the hedging program, underlying exposures and other factors, an independent change in the
following capital market factors is likely to have the following impacts. These sensitivities do not capture the impact of elapsed time on
liabilities or hedge assets. Each of the sensitivities set forth below is estimated individually under the indicated level of market
movement and from the market levels at September 30, 2010 and December 31, 2010, and without consideration of any correlation
among the key assumptions. In addition, there are other factors, including changes to the underlying hedging program, policyholder
behavior and variation in underlying fund performance relative to the hedged index, which could materially impact the GMWB liability.
As a result, these sensitivities do not necessarily reflect the financial impact from large shifts in the underlying indices or when multiple
risk factors are impacted. Actual net changes in the value of the GMWB liability, the related dynamic hedging program derivative assets
and the macro hedge program derivative assets may vary materially from those calculated using only the sensitivities disclosed below:
Pre-Tax/DAC Gain (Loss)
Net Impact
GMWB
Liability and
Dynamic
Hedge
Program
Macro
Hedge
Program [5]
Total Net
Impact
Net Impact
GMWB
Liability and
Dynamic
Hedge
Program
Macro
Hedge
Program [5]
Total Net
Impact
Capital Market Factor
Expected for fourth quarter based on
September 30, 2010
Expected for first quarter based on
December 31, 2010
Equity markets increase / decrease 1% [1] [2] $ (0) / 0 $ (34) / 34
$ (34) / 34 $ (0) / 0 $ (26) / 26
$ (26) / 26
Volatility increases / decreases 1% [3] $ (41) / 41 $ 16 / (16)
$ (25) / 25 $ (26) / 26 $ 15 / (15)
$ (11) / 11
Interest rates increase / decrease 1 basis
point [4] $ 2 / (2) $ (1) / 1
$ 1 / (1) $ 2 / (2) $ (2) / 2
$ 0 / 0
Yen strengthens / weakens 1% versus all other
currencies [5] $ — $ 44 / (44)
$ 44 / (44) $ — $ 57 / (57)
$ 57 / (57)
[1] Represents the aggregate net impact of a 1% increase or decrease in broadly traded global equity indices.
[2] The decrease in equity sensitivity in the macro hedge program was primarily due to equity markets rallying during the fourth quarter of 2010 and
the equity Futures macro hedge that was added in the third quarter of 2010 which was subsequently rebalanced and reduced in the fourth quarter
2010.
[3] Represents the aggregate net impact of a 1% increase or decrease in blended implied volatility that is generally skewed towards longer durations
for broadly traded global equity indices. The decrease in volatility sensitivity was primarily due to additional purchases of volatility coverage in
our dynamic hedge program.
[4] Represents the aggregate net impact of a 1 basis point parallel shift on the global LIBOR yield curve. The increase in interest rate sensitivity in
the macro hedge program was primarily due to additional purchases of interest rate coverage during the quarter.
[5] Represents the aggregate net impact, which includes other non-Macro FX hedges, of a 1% strengthening or weakening in the yen compared to all
other currencies. Due to the structure of the macro hedging program, the increase in currency sensitivity was primarily due to the additional
purchases of currency protection and a strengthened Yen during the quarter.
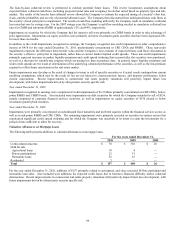
For the year ended December 31, 2010, the Company incurred a net realized pre-tax loss of $349 on GMWB liabilities, net of
reinsurance and the dynamic and macro hedging programs, driven primarily by increases in equity levels of approximately 13% and
decreases in interest rates of approximately 60 basis points, partially offset by decreases in volatility of approximately 2%, a
strengthened yen of approximately 12% against USD and 19% against Euro, favorable assumption updates, and underlying fund
performance relative to the hedge indices. As a result of the rebalancing of the hedging programs throughout 2010, the full year
hedging results are not indicative of the sensitivities outlined above.