The Hartford 2010 Annual Report Download - page 70
Download and view the complete annual report
Please find page 70 of the 2010 The Hartford annual report below. You can navigate through the pages in the report by either clicking on the pages listed below, or by using the keyword search tool below to find specific information within the annual report.-
 1
1 -
2
-
3
-
4
-
5
-
6
-
7
-
8
-
9
-
10
-
11
-
12
-
13
-
14
-
15
-
16
-
17
-
18
-
19
-
20
-
21
-
22
-
23
-
24
-
25
-
26
-
27
-
28
-
29
-
30
-
31
-
32
-
33
-
34
-
35
-
36
-
37
-
38
-
39
-
40
-
41
-
42
-
43
-
44
-
45
-
46
-
47
-
48
-
49
-
50
-
51
-
52
-
53
-
54
-
55
-
56
-
57
-
58
-
59
-
 60
60 -
 61
61 -
 62
62 -
 63
63 -
 64
64 -
 65
65 -
 66
66 -
 67
67 -
 68
68 -
 69
69 -
 70
70 -
 71
71 -
 72
72 -
 73
73 -
 74
74 -
 75
75 -
 76
76 -
 77
77 -
 78
78 -
 79
79 -
 80
80 -
81
-
82
-
83
-
84
-
85
-
86
-
87
-
88
-
89
-
90
-
91
-
92
-
93
-
94
-
95
-
96
-
97
-
98
-
99
-
100
-
101
-
102
-
103
-
104
-
105
-
106
-
107
-
108
-
109
-
110
-
111
-
112
-
113
-
114
-
115
-
116
-
117
-
118
-
119
-
120
-
121
-
122
-
123
-
124
-
125
-
126
-
127
-
128
-
129
-
130
-
131
-
132
-
133
-
134
-
135
-
136
-
137
-
138
-
139
-
140
-
141
-
142
-
143
-
144
-
145
-
146
-
147
-
148
-
149
-
150
-
151
-
152
-
153
-
154
-
155
-
156
-
157
-
158
-
159
-
160
-
161
-
162
-
163
-
164
-
165
-
166
-
167
-
168
-
169
-
170
-
171
-
172
-
173
-
174
-
175
-
176
-
177
-
178
-
179
-
180
-
181
-
182
-
183
-
184
-
185
-
186
-
187
-
188
-
189
-
190
-
191
-
192
-
193
-
194
-
195
-
196
-
197
-
198
-
199
-
200
-
201
-
202
-
203
-
204
-
205
-
206
-
207
-
208
-
209
-
210
-
211
-
212
-
213
-
214
-
215
-
216
-
217
-
218
-
219
-
220
-
221
-
222
-
223
-
224
-
225
-
226
-
227
-
228
-
229
-
230
-
231
-
232
-
233
-
234
-
235
-
236
-
237
-
238
-
239
-
240
-
241
-
242
-
243
-
244
-
245
-
246
-
247
-
248
 |
 |

70
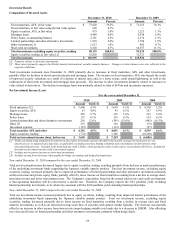
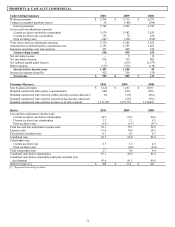
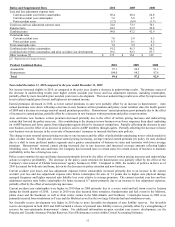
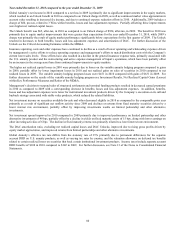
Net Realized Capital Gains (Losses)
For the years ended December 31,
2010 2009 2008
Gross gains on sales $836 $ 1,056 $607
Gross losses on sales (522) (1,397) (856)
Net OTTI losses recognized in earnings (434) (1,508) (3,964)
Valuation allowances on mortgage loans (157) (403) (26)
Japanese fixed annuity contract hedges, net [1] 27 47 64
Periodic net coupon settlements on credit derivatives/Japan (17) (49) (33)
Fair value measurement transition impact — — (650)
Results of variable annuity hedge program
GMWB derivatives, net 111 1,526 (713)
Macro hedge program (562) (895) 74
Total results of variable annuity hedge program (451) 631 (639)
Other, net [2] 164 (387) (421)
Net realized capital losses, before-tax $(554) $ (2,010) $(5,918)
[1] Relates to derivative hedging instruments, excluding periodic net coupon settlements, and is net of the Japanese fixed annuity product liability
adjustment for changes in the dollar/yen exchange spot rate.
[2] Primarily consists of losses on Japan 3Win related foreign currency swaps, changes in fair value on non-qualifying derivatives and fixed
maturities, FVO, and other investment gains and losses.
Details on the Company’ s net realized capital gains and losses are as follows:
Gross
g
ains and
losses on sales
• Gross gains and losses on sales for the year ended December 31, 2010 were predominantly from sales of
investment grade corporate securities in order to take advantage of attractive market opportunities, as well as,
sales of U.S. Treasuries related to tactical repositioning of the portfolio.
• Gross gains and losses on sales for the year ended December 31, 2009 were predominantly within corporate,
government and structured securities. Also included were gains of $360 related to the sale of Verisk/ISO
securities. Gross gains and losses on sales primarily resulted from efforts to reduce portfolio risk through sales
of subordinated financials and real estate related securities and from sales of U.S. Treasuries to manage
liquidity.
• Gross gains and losses on sales for the year ended December 31, 2008 primarily resulted from the decision to
reallocate the portfolio to securities with more favorable risk/return profiles. Also included was a gain of $141
from the sale of a synthetic CDO.
Net OTTI losses • For further information, see Other-Than-Temporary Impairments within the Investment Credit Risk section of
the MD&A.
Valuation
allowances on
mortgage loans
• For further information, see Valuation Allowances on Mortgage Loans within the Investment Credit Risk
section of the MD&A.