The Hartford 2010 Annual Report Download - page 209
Download and view the complete annual report
Please find page 209 of the 2010 The Hartford annual report below. You can navigate through the pages in the report by either clicking on the pages listed below, or by using the keyword search tool below to find specific information within the annual report.-
 1
1 -
2
-
3
-
4
-
5
-
6
-
7
-
8
-
9
-
10
-
11
-
12
-
13
-
14
-
15
-
16
-
17
-
18
-
19
-
20
-
21
-
22
-
23
-
24
-
25
-
26
-
27
-
28
-
29
-
30
-
31
-
32
-
33
-
34
-
35
-
36
-
37
-
38
-
39
-
40
-
41
-
42
-
43
-
44
-
45
-
46
-
47
-
48
-
49
-
50
-
51
-
52
-
53
-
54
-
55
-
56
-
57
-
58
-
59
-
60
-
61
-
62
-
63
-
64
-
65
-
66
-
67
-
68
-
69
-
70
-
71
-
72
-
73
-
74
-
75
-
76
-
77
-
78
-
79
-
80
-
81
-
82
-
83
-
84
-
85
-
86
-
87
-
88
-
89
-
90
-
91
-
92
-
93
-
94
-
95
-
96
-
97
-
98
-
99
-
100
-
101
-
102
-
103
-
104
-
105
-
106
-
107
-
108
-
109
-
110
-
111
-
112
-
113
-
114
-
115
-
116
-
117
-
118
-
119
-
120
-
121
-
122
-
123
-
124
-
125
-
126
-
127
-
128
-
129
-
130
-
131
-
132
-
133
-
134
-
135
-
136
-
137
-
138
-
139
-
140
-
141
-
142
-
143
-
144
-
145
-
146
-
147
-
148
-
149
-
150
-
151
-
152
-
153
-
154
-
155
-
156
-
157
-
158
-
159
-
160
-
161
-
162
-
163
-
164
-
165
-
166
-
167
-
168
-
169
-
170
-
171
-
172
-
173
-
174
-
175
-
176
-
177
-
178
-
179
-
180
-
181
-
182
-
183
-
184
-
185
-
186
-
187
-
188
-
189
-
190
-
191
-
192
-
193
-
194
-
195
-
196
-
197
-
198
-
 199
199 -
 200
200 -
 201
201 -
 202
202 -
 203
203 -
 204
204 -
 205
205 -
 206
206 -
 207
207 -
 208
208 -
 209
209 -
 210
210 -
 211
211 -
 212
212 -
 213
213 -
 214
214 -
 215
215 -
 216
216 -
 217
217 -
 218
218 -
 219
219 -
220
-
221
-
222
-
223
-
224
-
225
-
226
-
227
-
228
-
229
-
230
-
231
-
232
-
233
-
234
-
235
-
236
-
237
-
238
-
239
-
240
-
241
-
242
-
243
-
244
-
245
-
246
-
247
-
248
 |
 |

THE HARTFORD FINANCIAL SERVICES GROUP, INC.
NOTES TO CONSOLIDATED FINANCIAL STATEMENTS (continued)
F-81
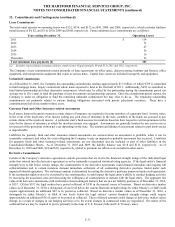
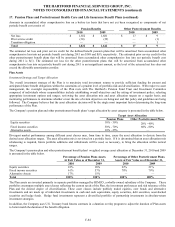
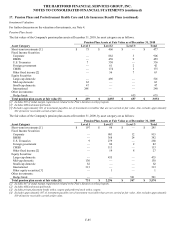
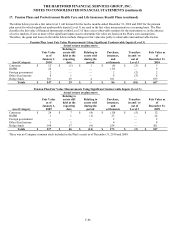
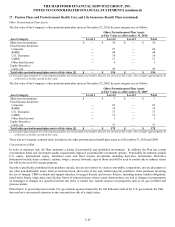
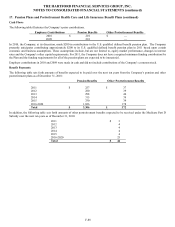
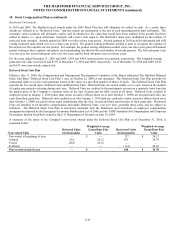
17. Pension Plans and Postretirement Health Care and Life Insurance Benefit Plans
The Company maintains a qualified defined benefit pension plan (the “Plan”) that covers substantially all employees. Effective for all
employees who joined the Company on or after January 1, 2001, a new component or formula was applied under the Plan referred to as
the “cash balance formula”. Effective January 1, 2009, the Company began using a cash balance formula to calculate future pension
benefits for services rendered on or after January 1, 2009 for all employees hired before January 1, 2001. These amounts are in addition
to amounts earned by those employees through December 31, 2008 under the traditional final average pay formula.
The Company also maintains non-qualified pension plans to accrue retirement benefits in excess of Internal Revenue Code limitations.
The Company provides certain health care and life insurance benefits for eligible retired employees. The Company’ s contribution for
health care benefits will depend upon the retiree’ s date of retirement and years of service. In addition, the plan has a defined dollar cap
for certain retirees which limits average Company contributions. The Hartford has prefunded a portion of the health care obligations
through a trust fund where such prefunding can be accomplished on a tax effective basis. Effective January 1, 2002, Company-
subsidized retiree medical, retiree dental and retiree life insurance benefits were eliminated for employees with original hire dates with
the Company on or after January 1, 2002.
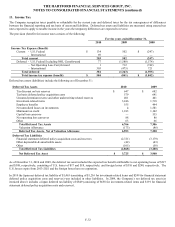
Assumptions
Pursuant to accounting principles related to the Company’ s pension and other postretirement obligations to employees under its various
benefit plans, the Company is required to make a significant number of assumptions in order to calculate the related liabilities and
expenses each period. The two economic assumptions that have the most impact on pension and other postretirement expense are the
discount rate and the expected long-term rate of return on plan assets. In determining the discount rate assumption, the Company
utilizes a discounted cash flow analysis of the Company’ s pension and other postretirement obligations and currently available market
and industry data. The yield curve utilized in the cash flow analysis is comprised of bonds rated Aa or higher with maturities primarily
between zero and thirty years. Based on all available information, it was determined that 5.50% and 5.25% were the appropriate
discount rates as of December 31, 2010 to calculate the Company’ s pension and other postretirement obligations, respectively.
Accordingly, the 5.50% and 5.25% discount rates will also be used to determine the Company’ s 2011 pension and other postretirement
expense, respectively.
The Company determines the expected long-term rate of return assumption based on an analysis of the Plan portfolio’ s historical
compound rates of return since 1979 (the earliest date for which comparable portfolio data is available) and over 5 year and 10 year
periods. The Company selected these periods, as well as shorter durations, to assess the portfolio’ s volatility, duration and total returns
as they relate to pension obligation characteristics, which are influenced by the Company’ s workforce demographics. In addition, the
Company also applies long-term market return assumptions to an investment mix that generally anticipates 60% fixed income securities,
20% equity securities and 20% alternative assets to derive an expected long-term rate of return. Based upon these analyses,
management maintained the long-term rate of return assumption at 7.30% as of December 31, 2010. This assumption will be used to
determine the Company’ s 2011 expense.
Weighted average assumptions used in calculating the benefit obligations and the net amount recognized for the years ended December
31, 2010 and 2009 were as follows:
Pension Benefits Other Postretirement Benefits
2010 2009 2010 2009
Discount rate 5.50% 6.00% 5.25% 5.75%
Rate of increase in compensation levels 4.00% 4.00% N/A N/A
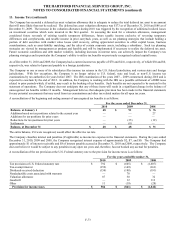
Weighted average assumptions used in calculating the net periodic benefit cost for the Company’ s pension plans were as follows:
For the years ended December 31,
2010 2009 2008
Discount rate 6.00% 6.25% 6.25%
Expected long-term rate of return on plan assets 7.30% 7.30% 7.30%
Rate of increase in compensation levels 4.00% 4.25% 4.25%
Weighted average assumptions used in calculating the net periodic benefit cost for the Company’ s other postretirement plans were as
follows:
For the years ended December 31,
2010 2009 2008
Discount rate 5.75% 6.25% 6.25%
Expected long-term rate of return on plan assets 7.30% 7.30% 7.30%