The Hartford 2010 Annual Report Download - page 105
Download and view the complete annual report
Please find page 105 of the 2010 The Hartford annual report below. You can navigate through the pages in the report by either clicking on the pages listed below, or by using the keyword search tool below to find specific information within the annual report.-
 1
1 -
2
-
3
-
4
-
5
-
6
-
7
-
8
-
9
-
10
-
11
-
12
-
13
-
14
-
15
-
16
-
17
-
18
-
19
-
20
-
21
-
22
-
23
-
24
-
25
-
26
-
27
-
28
-
29
-
30
-
31
-
32
-
33
-
34
-
35
-
36
-
37
-
38
-
39
-
40
-
41
-
42
-
43
-
44
-
45
-
46
-
47
-
48
-
49
-
50
-
51
-
52
-
53
-
54
-
55
-
56
-
57
-
58
-
59
-
60
-
61
-
62
-
63
-
64
-
65
-
66
-
67
-
68
-
69
-
70
-
71
-
72
-
73
-
74
-
75
-
76
-
77
-
78
-
79
-
80
-
81
-
82
-
83
-
84
-
85
-
86
-
87
-
88
-
89
-
90
-
91
-
92
-
93
-
94
-
 95
95 -
 96
96 -
 97
97 -
 98
98 -
 99
99 -
 100
100 -
 101
101 -
 102
102 -
 103
103 -
 104
104 -
 105
105 -
 106
106 -
 107
107 -
 108
108 -
 109
109 -
 110
110 -
 111
111 -
 112
112 -
 113
113 -
 114
114 -
 115
115 -
116
-
117
-
118
-
119
-
120
-
121
-
122
-
123
-
124
-
125
-
126
-
127
-
128
-
129
-
130
-
131
-
132
-
133
-
134
-
135
-
136
-
137
-
138
-
139
-
140
-
141
-
142
-
143
-
144
-
145
-
146
-
147
-
148
-
149
-
150
-
151
-
152
-
153
-
154
-
155
-
156
-
157
-
158
-
159
-
160
-
161
-
162
-
163
-
164
-
165
-
166
-
167
-
168
-
169
-
170
-
171
-
172
-
173
-
174
-
175
-
176
-
177
-
178
-
179
-
180
-
181
-
182
-
183
-
184
-
185
-
186
-
187
-
188
-
189
-
190
-
191
-
192
-
193
-
194
-
195
-
196
-
197
-
198
-
199
-
200
-
201
-
202
-
203
-
204
-
205
-
206
-
207
-
208
-
209
-
210
-
211
-
212
-
213
-
214
-
215
-
216
-
217
-
218
-
219
-
220
-
221
-
222
-
223
-
224
-
225
-
226
-
227
-
228
-
229
-
230
-
231
-
232
-
233
-
234
-
235
-
236
-
237
-
238
-
239
-
240
-
241
-
242
-
243
-
244
-
245
-
246
-
247
-
248
 |
 |

105
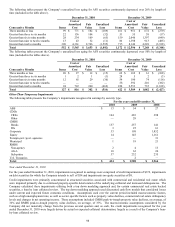
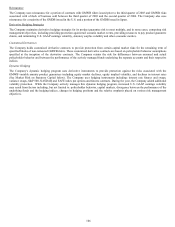
Variable Product Equity Risk Management
Market Risk Exposures
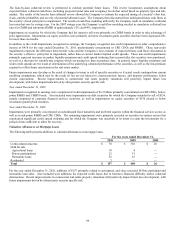
The following table summarizes the broad Variable Annuity Guarantees offered by the Company and the market risks to which the
guarantee is most exposed from a U.S. GAAP accounting perspective.
Variable Annuity Guarantee [1] U.S. GAAP Treatment [1] Primary Market Risk Exposures [1]
U.S Variable Guarantees
GMDB Accumulation of the portion of fees
required to cover expected claims, less
accumulation of actual claims paid
Equity Market Levels
GMWB Fair Value Equity Market Levels / Implied Volatility /
Interest Rates
For Life Component of GMWB Accumulation of the portion of fees
required to cover expected claims, less
accumulation of actual claims paid
Equity Market Levels
International Variable Guarantees
GMDB & GMIB Accumulation of the portion of fees
required to cover expected claims, less
accumulation of actual claims paid
Equity Market Levels / Interest Rates /
Foreign Currency
GMWB Fair Value Equity Market Levels / Implied Volatility /
Interest Rates / Foreign Currency
GMAB Fair Value Equity Market Levels / Implied Volatility /
Interest Rates / Foreign Currency
[1] Each of these guarantees and the related U.S. GAAP accounting volatility will also be influenced by actual and estimated policyholder
behavior.
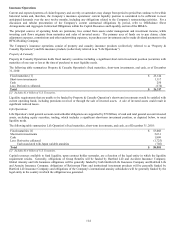
Risk Management
The Company carefully analyzes GMDB, GMWB, GMIB, and GMAB market risk exposures arising from equity markets, interest rates,
implied volatility, foreign currency exchange risk, and correlation between these market risk exposures. The Company evaluates these
risks both individually and in the aggregate, to determine the financial risk of its products and to judge their potential impacts on U.S.
GAAP earnings, statutory surplus, and ultimately cach flow liability. The Company manages the equity market, interest rate, implied
volatility and foreign currency exchange risks embedded in its products through reinsurance, customized derivatives, and dynamic
hedging and macro hedging programs. In addition, the Company recently launched a new variable annuity product with reduced equity
risk and has increased GMWB rider fees on new sales of the Company’ s legacy variable annuities and the related in-force policies, as
contractually permitted. Depending upon competitors’ reactions with respect to products and related rider charges, the Company’ s
strategy of reducing product risk and increasing fees has and may continue to result in a decline in market share.
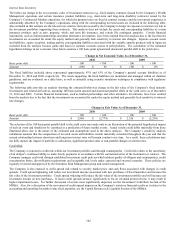
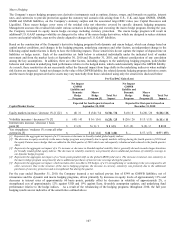
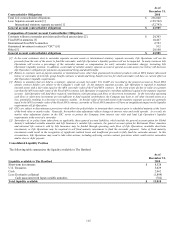
The following table depicts the type of risk management strategy being used by the Company to either partially or fully mitigate market
risk exposures, displayed above, by variable annuity guarantee as of December 31, 2010:
Variable Annuity Guarantee Reinsurance Customized Derivative Dynamic Hedging [1] Macro Hedging [2]
GMDB 9
9
GMWB 9 9 9 9
For Life Component of GMWB 9
GMIB
9
GMAB
9
[1] Through the year ended 2010, the Company continued to maintain a reduced level of dynamic hedge protection on GMWB while placing a
greater relative emphasis on the protection of statutory surplus through the inclusion of a macro hedging program. This portion of the
GMWB hedge strategy may include derivatives with maturities of up to 10 years. U.S. GAAP fair value volatility will be driven by a reduced
level of dynamic hedge protection and macro program positions.
[2] As described below, the Company’s macro hedging program is not designed to provide protection against any one variable annuity guarantee
program, but rather is a broad based hedge designed to provide protection against multiple guarantees and market risks, primarily focused
on statutory liability and surplus volatility.