The Hartford 2010 Annual Report Download - page 95
Download and view the complete annual report
Please find page 95 of the 2010 The Hartford annual report below. You can navigate through the pages in the report by either clicking on the pages listed below, or by using the keyword search tool below to find specific information within the annual report.-
 1
1 -
2
-
3
-
4
-
5
-
6
-
7
-
8
-
9
-
10
-
11
-
12
-
13
-
14
-
15
-
16
-
17
-
18
-
19
-
20
-
21
-
22
-
23
-
24
-
25
-
26
-
27
-
28
-
29
-
30
-
31
-
32
-
33
-
34
-
35
-
36
-
37
-
38
-
39
-
40
-
41
-
42
-
43
-
44
-
45
-
46
-
47
-
48
-
49
-
50
-
51
-
52
-
53
-
54
-
55
-
56
-
57
-
58
-
59
-
60
-
61
-
62
-
63
-
64
-
65
-
66
-
67
-
68
-
69
-
70
-
71
-
72
-
73
-
74
-
75
-
76
-
77
-
78
-
79
-
80
-
81
-
82
-
83
-
84
-
 85
85 -
 86
86 -
 87
87 -
 88
88 -
 89
89 -
 90
90 -
 91
91 -
 92
92 -
 93
93 -
 94
94 -
 95
95 -
 96
96 -
 97
97 -
 98
98 -
 99
99 -
 100
100 -
 101
101 -
 102
102 -
 103
103 -
 104
104 -
 105
105 -
106
-
107
-
108
-
109
-
110
-
111
-
112
-
113
-
114
-
115
-
116
-
117
-
118
-
119
-
120
-
121
-
122
-
123
-
124
-
125
-
126
-
127
-
128
-
129
-
130
-
131
-
132
-
133
-
134
-
135
-
136
-
137
-
138
-
139
-
140
-
141
-
142
-
143
-
144
-
145
-
146
-
147
-
148
-
149
-
150
-
151
-
152
-
153
-
154
-
155
-
156
-
157
-
158
-
159
-
160
-
161
-
162
-
163
-
164
-
165
-
166
-
167
-
168
-
169
-
170
-
171
-
172
-
173
-
174
-
175
-
176
-
177
-
178
-
179
-
180
-
181
-
182
-
183
-
184
-
185
-
186
-
187
-
188
-
189
-
190
-
191
-
192
-
193
-
194
-
195
-
196
-
197
-
198
-
199
-
200
-
201
-
202
-
203
-
204
-
205
-
206
-
207
-
208
-
209
-
210
-
211
-
212
-
213
-
214
-
215
-
216
-
217
-
218
-
219
-
220
-
221
-
222
-
223
-
224
-
225
-
226
-
227
-
228
-
229
-
230
-
231
-
232
-
233
-
234
-
235
-
236
-
237
-
238
-
239
-
240
-
241
-
242
-
243
-
244
-
245
-
246
-
247
-
248
 |
 |

95
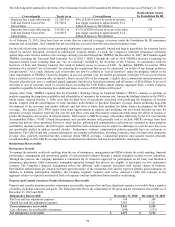
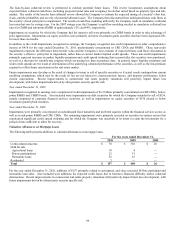
Financial Services
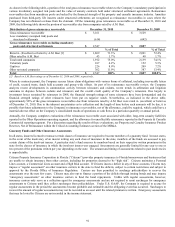
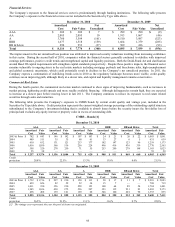
The Company’ s exposure to the financial services sector is predominantly through banking institutions. The following table presents
the Company’ s exposure to the financial services sector included in the Securities by Type table above.
December 31, 2010 December 31, 2009
Amortized
Cost
Fair Value
Net
Unrealized Amortized
Cost
Fair Value
Net
Unrealized
AAA $ 302 $ 309 $ 7 $ 299 $ 290
$(9)
AA 2,085 2,095 10 1,913 1,867 (46)
A 3,760 3,599 (161) 4,510 3,987 (523)
BBB 1,677 1,518 (159) 1,664 1,379 (285)
BB & below 290 253 (37) 509 416 (93)
Total $ 8,114 $ 7,774 $ (340) $ 8,895 $ 7,939 $ (956)
The improvement in the net unrealized loss position was attributed to improved security valuations resulting from increasing confidence
in this sector. During the second half of 2010, companies within the financial sectors generally continued to stabilize with improved
earnings performance, positive credit trends and strengthened capital and liquidity positions. Both the Dodd-Frank Act and clarification
around Basel III capital requirements will strengthen capital standards prospectively. Despite these positive impacts, the financial sector
remains vulnerable to ongoing stress in the real estate markets including mortgage put-back and foreclosure risks, high unemployment
and global economic uncertainty, which could potentially result in declines in the Company’ s net unrealized position. In 2011, the
Company expects a continuation of stabilizing trends seen in 2010 as the regulatory landscape becomes more visible, credit quality
continues on an improving path, although likely at a slower rate, and capital and liquidity management remains conservative.
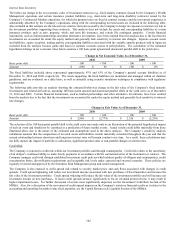
Commercial Real Estate
During the fourth quarter, the commercial real estate market continued to show signs of improving fundamentals, such as increases in
market pricing, tightening credit spreads and more readily available financing. Although delinquencies remain high, they are expected
to increase at a slower pace before moving lower in late 2011. The Company continues to reduce its exposure to real estate related
securities through sales and maturities.
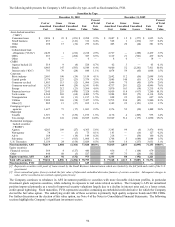
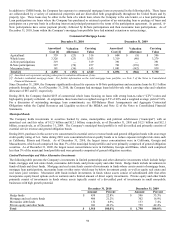
The following table presents the Company’ s exposure to CMBS bonds by current credit quality and vintage year, included in the
Securities by Type table above. Credit protection represents the current weighted average percentage of the outstanding capital structure
subordinated to the Company’ s investment holding that is available to absorb losses before the security incurs the first dollar loss of
principal and excludes any equity interest or property value in excess of outstanding debt.
CMBS – Bonds [1]
December 31, 2010
AAA AA A BBB
BB and Below Total
Amortized
Cost
Fair
Value
Amortized
Cost
Fair
Value
Amortized
Cost
Fair
Value
Amortized
Cost
Fair
Value
Amortized
Cost
Fair
Value
Amortized
Cost
Fair
Value
2003 & Prior $ 782 $ 803 $ 146 $ 142 $ 107 $ 103 $ 24 $ 21 $ 26 $ 22 $ 1,085 $ 1,091
2004 489 511 35 35 68 61 33 27 6 5 631 639
2005 610 632 131 121 213 177 182 147 123 96 1,259 1,173
2006 1,016 1,050 566 536 256 224 496 416 436 339 2,770 2,565
2007 305 320 278 250 71 55 253 200 278 198 1,185 1,023
2008 55 58 — — — — — — — — 55 58
Total $ 3,257 $ 3,374 $ 1,156 $ 1,084 $ 715 $ 620 $ 988 $ 811 $ 869 $ 660 $ 6,985 $ 6,549
Credit
protection 28.8% 22.5% 13.3% 13.8% 8.0% 21.5%
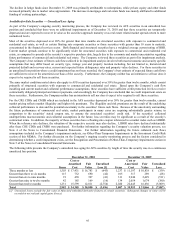
December 31, 2009
AAA AA A BBB
BB and Below Total
Amortized
Cost
Fair
Value
Amortized
Cost
Fair
Value
Amortized
Cost
Fair
Value
Amortized
Cost
Fair
Value
Amortized
Cost
Fair
Value
Amortized
Cost
Fair
Value
2003 & Prior $ 1,732 $ 1,716 $ 297 $ 230 $ 150 $ 113 $ 20 $ 17 $ 11 $ 7 $ 2,210 $ 2,083
2004 639 626 82 52 52 34 15 7 — — 788 719
2005 1,011 930 356 230 228 123 100 64 89 54 1,784 1,401
2006 1,945 1,636 430 275 536 247 323 132 231 83 3,465 2,373
2007 498 408 139 101 169 68 346 160 201 98 1,353 835
Total $ 5,825 $ 5,316 $ 1,304 $ 888 $ 1,135 $ 585 $ 804 $ 380 $ 532 $ 242 $ 9,600 $ 7,411
Credit
protection 26.5% 21.2% 13.1% 11.6% 8.7% 22.0%
[1] The vintage year represents the year the pool of loans was originated.