The Hartford 2010 Annual Report Download - page 143
Download and view the complete annual report
Please find page 143 of the 2010 The Hartford annual report below. You can navigate through the pages in the report by either clicking on the pages listed below, or by using the keyword search tool below to find specific information within the annual report.-
 1
1 -
2
-
3
-
4
-
5
-
6
-
7
-
8
-
9
-
10
-
11
-
12
-
13
-
14
-
15
-
16
-
17
-
18
-
19
-
20
-
21
-
22
-
23
-
24
-
25
-
26
-
27
-
28
-
29
-
30
-
31
-
32
-
33
-
34
-
35
-
36
-
37
-
38
-
39
-
40
-
41
-
42
-
43
-
44
-
45
-
46
-
47
-
48
-
49
-
50
-
51
-
52
-
53
-
54
-
55
-
56
-
57
-
58
-
59
-
60
-
61
-
62
-
63
-
64
-
65
-
66
-
67
-
68
-
69
-
70
-
71
-
72
-
73
-
74
-
75
-
76
-
77
-
78
-
79
-
80
-
81
-
82
-
83
-
84
-
85
-
86
-
87
-
88
-
89
-
90
-
91
-
92
-
93
-
94
-
95
-
96
-
97
-
98
-
99
-
100
-
101
-
102
-
103
-
104
-
105
-
106
-
107
-
108
-
109
-
110
-
111
-
112
-
113
-
114
-
115
-
116
-
117
-
118
-
119
-
120
-
121
-
122
-
123
-
124
-
125
-
126
-
127
-
128
-
129
-
130
-
131
-
132
-
 133
133 -
 134
134 -
 135
135 -
 136
136 -
 137
137 -
 138
138 -
 139
139 -
 140
140 -
 141
141 -
 142
142 -
 143
143 -
 144
144 -
 145
145 -
 146
146 -
 147
147 -
 148
148 -
 149
149 -
 150
150 -
 151
151 -
 152
152 -
 153
153 -
154
-
155
-
156
-
157
-
158
-
159
-
160
-
161
-
162
-
163
-
164
-
165
-
166
-
167
-
168
-
169
-
170
-
171
-
172
-
173
-
174
-
175
-
176
-
177
-
178
-
179
-
180
-
181
-
182
-
183
-
184
-
185
-
186
-
187
-
188
-
189
-
190
-
191
-
192
-
193
-
194
-
195
-
196
-
197
-
198
-
199
-
200
-
201
-
202
-
203
-
204
-
205
-
206
-
207
-
208
-
209
-
210
-
211
-
212
-
213
-
214
-
215
-
216
-
217
-
218
-
219
-
220
-
221
-
222
-
223
-
224
-
225
-
226
-
227
-
228
-
229
-
230
-
231
-
232
-
233
-
234
-
235
-
236
-
237
-
238
-
239
-
240
-
241
-
242
-
243
-
244
-
245
-
246
-
247
-
248
 |
 |

THE HARTFORD FINANCIAL SERVICES GROUP, INC.
NOTES TO CONSOLIDATED FINANCIAL STATEMENTS (continued)
F-15
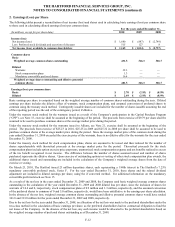
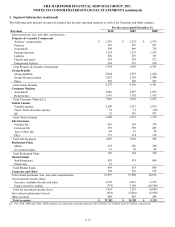
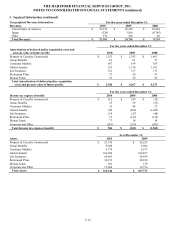
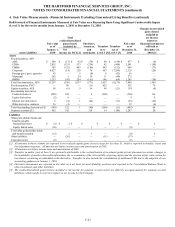
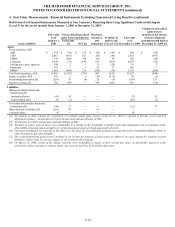
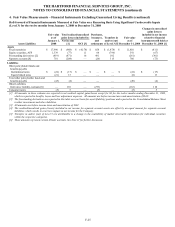
3. Segment Information (continued)
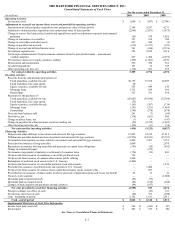
The following table presents revenues by product line for each reporting segment, as well as the Corporate and Other category.
For the years ended December 31,
Revenues 2010 2009 2008
Earned premiums, fees, and other considerations
Property & Casualty Commercial
Workers’ compensation $ 2,387 $ 2,275 $2,376
Property 547 597 697
Automobile 598 646 726
Package business 1,124 1,123 1,167
Liability 540 619 747
Fidelity and surety 224 250 272
Professional liability 324 393 410
Total Property & Casualty Commercial 5,744 5,903 6,395
Group Benefits
Group disability 2,004 1,975 2,020
Group life and accident 2,052 2,126 2,084
Other 222 249 287
Total Group Benefits 4,278 4,350 4,391
Consumer Markets
Automobile 2,806 2,857 2,833
Homeowners 1,141 1,102 1,102
Total Consumer Markets [1] 3,947 3,959 3,935
Global Annuity
Variable annuity 2,506 2,231 2,819
Fixed / MVA and other annuity 74 61 (10)
IIP 22 381 923
Total Global Annuity 2,602 2,673 3,732
Life Insurance
Variable life 416 503 374
Universal life 391 390 405
Term / Other life 49 47 49
PPLI 173 114 118
Total Life Insurance 1,029 1,054 946
Retirement Plans
401(k) 318 286 290
Government plans 41 38 48
Total Retirement Plans 359 324 338
Mutual Funds
Non-Proprietary 629 518 666
Proprietary 61 — —
Total Mutual Funds 690 518 666
Corporate and Other 190 219 235
Total earned premiums, fees, and other considerations 18,839 19,000 20,638
Net investment income (loss):
Securities available-for-sale and other 4,392 4,031 4,335
Equity securities, trading (774) 3,188 (10,340)
Total net investment income (loss) 3,618 7,219 (6,005)
Net realized capital gains (losses) (554) (2,010) (5,918)
Other revenues 480 492 504
Total revenues $22,383 $ 24,701 $9,219
[1] For 2010, 2009 and 2008, AARP members accounted for earned premiums of $2.9 billion, $2.8 billion and $2.8 billion, respectively.