The Hartford 2010 Annual Report Download - page 97
Download and view the complete annual report
Please find page 97 of the 2010 The Hartford annual report below. You can navigate through the pages in the report by either clicking on the pages listed below, or by using the keyword search tool below to find specific information within the annual report.-
 1
1 -
2
-
3
-
4
-
5
-
6
-
7
-
8
-
9
-
10
-
11
-
12
-
13
-
14
-
15
-
16
-
17
-
18
-
19
-
20
-
21
-
22
-
23
-
24
-
25
-
26
-
27
-
28
-
29
-
30
-
31
-
32
-
33
-
34
-
35
-
36
-
37
-
38
-
39
-
40
-
41
-
42
-
43
-
44
-
45
-
46
-
47
-
48
-
49
-
50
-
51
-
52
-
53
-
54
-
55
-
56
-
57
-
58
-
59
-
60
-
61
-
62
-
63
-
64
-
65
-
66
-
67
-
68
-
69
-
70
-
71
-
72
-
73
-
74
-
75
-
76
-
77
-
78
-
79
-
80
-
81
-
82
-
83
-
84
-
85
-
86
-
 87
87 -
 88
88 -
 89
89 -
 90
90 -
 91
91 -
 92
92 -
 93
93 -
 94
94 -
 95
95 -
 96
96 -
 97
97 -
 98
98 -
 99
99 -
 100
100 -
 101
101 -
 102
102 -
 103
103 -
 104
104 -
 105
105 -
 106
106 -
 107
107 -
108
-
109
-
110
-
111
-
112
-
113
-
114
-
115
-
116
-
117
-
118
-
119
-
120
-
121
-
122
-
123
-
124
-
125
-
126
-
127
-
128
-
129
-
130
-
131
-
132
-
133
-
134
-
135
-
136
-
137
-
138
-
139
-
140
-
141
-
142
-
143
-
144
-
145
-
146
-
147
-
148
-
149
-
150
-
151
-
152
-
153
-
154
-
155
-
156
-
157
-
158
-
159
-
160
-
161
-
162
-
163
-
164
-
165
-
166
-
167
-
168
-
169
-
170
-
171
-
172
-
173
-
174
-
175
-
176
-
177
-
178
-
179
-
180
-
181
-
182
-
183
-
184
-
185
-
186
-
187
-
188
-
189
-
190
-
191
-
192
-
193
-
194
-
195
-
196
-
197
-
198
-
199
-
200
-
201
-
202
-
203
-
204
-
205
-
206
-
207
-
208
-
209
-
210
-
211
-
212
-
213
-
214
-
215
-
216
-
217
-
218
-
219
-
220
-
221
-
222
-
223
-
224
-
225
-
226
-
227
-
228
-
229
-
230
-
231
-
232
-
233
-
234
-
235
-
236
-
237
-
238
-
239
-
240
-
241
-
242
-
243
-
244
-
245
-
246
-
247
-
248
 |
 |

97
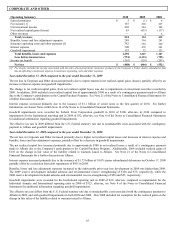
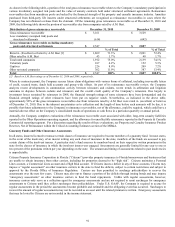
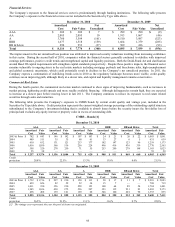
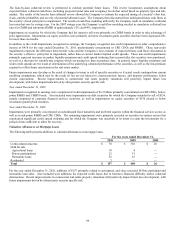
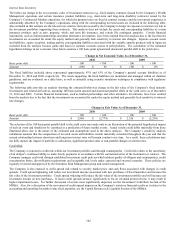
The decline in hedge funds since December 31, 2009 was primarily attributable to redemptions, while private equity and other funds
increased primarily due to market value appreciation. The increase in mortgage and real estate funds was mainly attributed to additional
funding of existing partnerships.
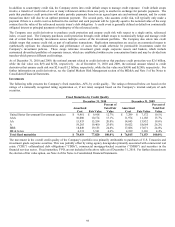
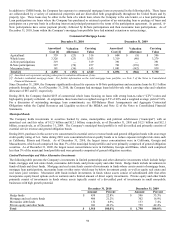
Available-for-Sale Securities — Unrealized Loss Aging
As part of the Company’ s ongoing security monitoring process, the Company has reviewed its AFS securities in an unrealized loss
position and concluded that there were no additional impairments as of December 31, 2010 and that these securities are temporarily
depressed and are expected to recover in value as the securities approach maturity or as real estate related market spreads return to more
normalized levels.
Most of the securities depressed over 20% for greater than nine months are structured securities with exposure to commercial and
residential real estate, as well as certain floating rate corporate securities or those securities with greater than 10 years to maturity,
concentrated in the financial services sector. Both financial and structured securities have a weighted average current rating of BBB.
Current market spreads continue to be significantly wider for structured securities with exposure to commercial and residential real
estate, as compared to spreads at the security’ s respective purchase date, largely due to the economic and market uncertainties regarding
future performance of commercial and residential real estate. The Company reviewed these securities as part of its impairment analysis.
The Company’ s best estimate of future cash flows utilized in its impairment analysis involves both macroeconomic and security specific
assumptions that may differ based on security type, vintage year and property location including, but not limited to, historical and
projected default and recovery rates, current and expected future delinquency rates and property value declines. For these securities in
an unrealized loss position where a credit impairment has not been recorded, the Company’ s best estimate of expected future cash flows
are sufficient to recover the amortized cost basis of the security. Furthermore, the Company neither has an intention to sell nor does it
expect to be required to sell these securities.
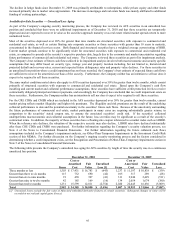
The same market conditions noted above also apply to AFS securities depressed over 50% for greater than twelve months, which consist
primarily of structured securities with exposure to commercial and residential real estate. Based upon the Company’ s cash flow
modeling and current market and collateral performance assumptions, these securities have sufficient credit protection levels to receive
contractually obligated principal and interest payments, and accordingly the Company has concluded that no credit impairment exists on
these securities. Furthermore, the Company neither has an intention to sell nor does it expect to be required to sell these securities.
For the CRE CDOs and CMBS which are included in the AFS securities depressed over 50% for greater than twelve months, current
market pricing reflects market illiquidity and higher risk premiums. The illiquidity and risk premiums are the result of the underlying
collateral performance to date and the potential uncertainty in the securities’ future cash flows. Because of the uncertainty surrounding
the future performance of commercial real estate, market participants in many cases are requiring substantially greater returns, in
comparison to the securities’ stated coupon rate, to assume the associated securities’ credit risk. If the securities’ collateral
underperforms macroeconomic and collateral assumptions in the future, loss severities may be significant as a result of the security’ s
contractual terms. In addition, the majority of these securities have a floating-rate coupon referenced to a market index such as LIBOR.
When the reference rate declines, the valuation of the respective security may also decline. LIBOR rates have declined substantially
after these CRE CDOs and CMBS were purchased. For further information regarding the Company’ s security valuation process, see
Note 4 of the Notes to Consolidated Financial Statements. For further information regarding the future collateral cash flows
assumptions included in the Company’ s impairment analysis, see Other-Than-Temporary Impairments in the Investment Credit Risk
section of this MD&A. For further discussion on the Company’ s ongoing security monitoring process and the factors considered in
determining whether a credit impairment exists, see the Recognition and Presentation of Other-Than-Temporary Impairments section in
Note 5 of the Notes to Consolidated Financial Statements.
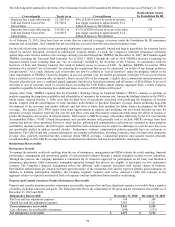
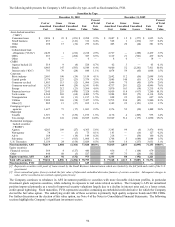
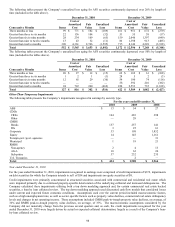
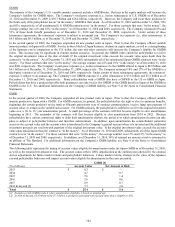
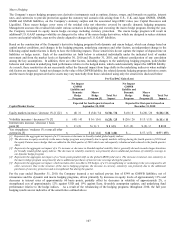
The following table presents the Company’ s unrealized loss aging for AFS securities by length of time the security was in a continuous
unrealized loss position.
December 31, 2010 December 31, 2009
Items
Cost or
Amortized
Cost
Fair
Value
Unrealized
Loss [1]
Items
Cost or
Amortized
Cost
Fair
Value
Unrealized
Loss
Three months or less 1,503 $ 17,431 $ 16,783 $ (643) 1,237 $ 11,197 $ 10,838 $ (359)
Greater than three to six months 115 732 690 (42) 105 317 289 (28)
Greater than six to nine months 91 438 397 (41) 311 2,940 2,429 (511)
Greater than nine to twelve months 42 185 169 (16) 134 2,054 1,674 (380)
Greater than twelve months 1,231 15,599 12,811 (2,754) 2,020 22,445 16,636 (5,809)
Total 2,982 $ 34,385 $ 30,850 $ (3,496) 3,807 $ 38,953 $ 31,866 $ (7,087)
[1] Unrealized losses exclude the fair value of bifurcated embedded derivative features of certain securities. Subsequent changes in value will be
recorded in net realized capital gains (losses).